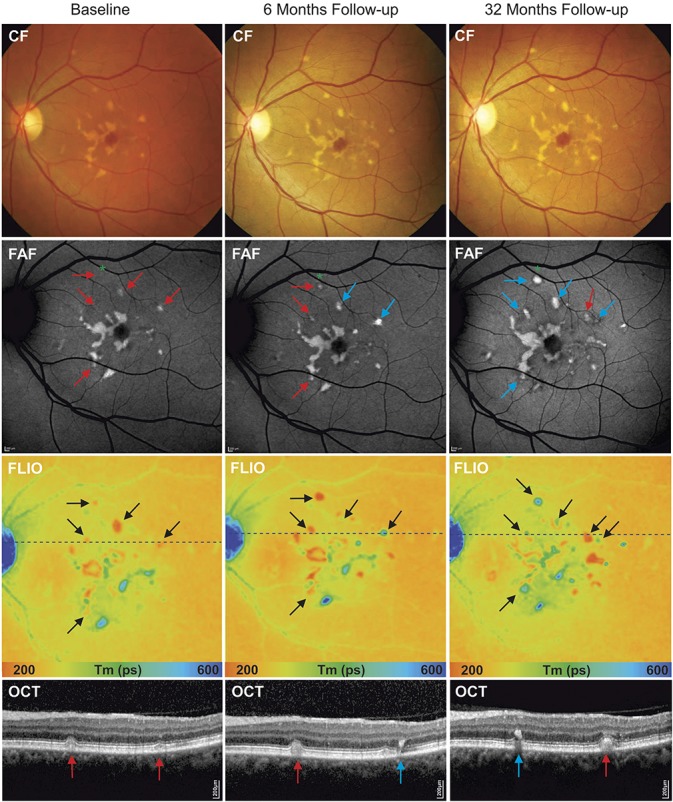
Fig. 3.

Disease progression within 6- and 32-month follow-up (Patient STGD 9). Color fundus (CF), FAF intensity, and fluorescence lifetime (FLIO, LSC) images. Correlating OCT scan of the indicated lines in the FLIO images are shown below. From baseline (left) to 6-month follow-up (middle), to 32-month follow-up (right), clear disease progression is visible with transition of flecks with short fluorescence lifetimes (red arrows and corresponding black arrows in FLIO) to flecks with long fluorescence lifetimes (blue arrows and corresponding black arrows in FLIO) and appearance of new hyperfluorescent flecks. *Indicates a fleck with short fluorescence lifetime initially not visible on FAF intensity image at baseline, but detectable on follow-up.
