
FIGURE 2.
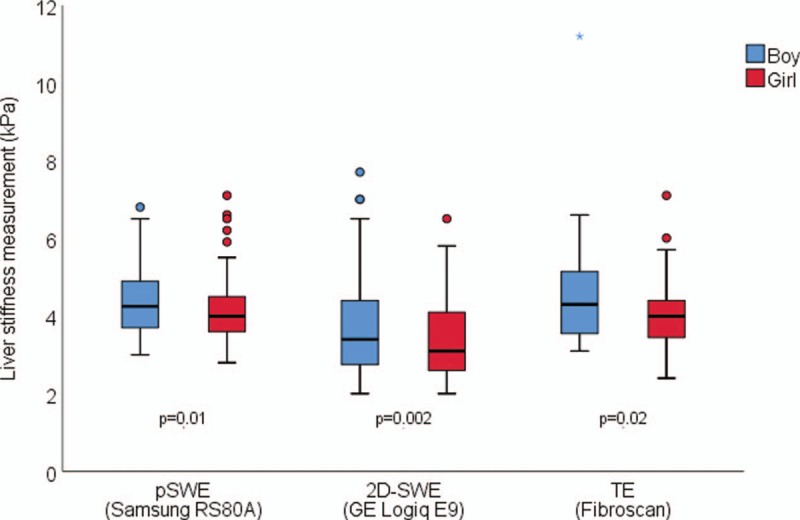
Liver stiffness measurements in boys (blue) and girls (red) aged 12 to 17 years as assessed by point shear wave elastography (pSWE), 2-dimensional shear wave elastography (2D-SWE), and transient elastography (TE). The figure shows liver stiffness as assessed by pSWE (Samsung RS80A with Prestige; n = 117), 2D-SWE (GE Logiq E9, n = 120), and TE (FibroScan, n = 60), respectively. Boxes represent the central 50% of the values, with the median value given as a horizontal line, and whiskers representing minimum and maximum, excluding outliers (small circles). Overall liver stiffness measurements (LSM) values are significantly lower in girls for all platforms: pSWE (P = 0.01), 2D-SWE (P = 0.002), and TE (P = 0.02).