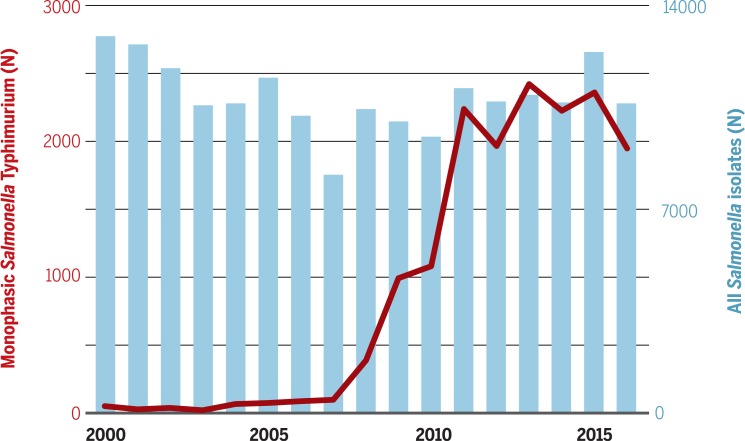
Fig. 3.
The epidemic of monophasic Salmonella Typhimurium (1,4,[5],12:i:-). The graph shows the number of Salmonella isolates from human infections at the French National Reference Centre for Salmonella during 2000 to 2016. The blue bars depict the total number of Salmonella spp. isolated by year over the defined period; the red plot depicts the number of Salmonella Typhimurium (1,4,[5],12:i:-) isolated by year.

