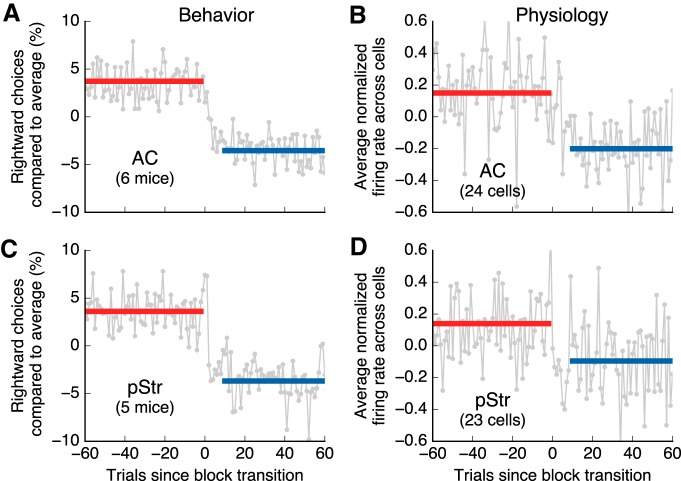
Figure 9.
Neurons in AC and pStr rapidly changed firing after changes in reward contingency. A, Change in the fraction of rightward choices after a change in reward contingency for animals with AC recordings. The plot shows the average across all animals and all block switches (gray line). The data for each session was normalized to the average of rightward choices before averaging. The solid lines show the average values before the switch (red) and after the switch (blue). The fraction of choices reaches an asymptote at ∼10 trials. B, Change in activity during movement for reward-modulated AC neurons after a change in reward contingency. Only data for each cell's preferred choice is used in this analysis. For each cell, the mean firing during the movement period was subtracted and the result was divided by the SD of the activity before the switch. The gray line shows the average across all modulated cells. The solid lines show averages before (red) and after (blue) the switch. C, Same as A for animals with pStr recordings. D, Same as B for pStr neurons.

