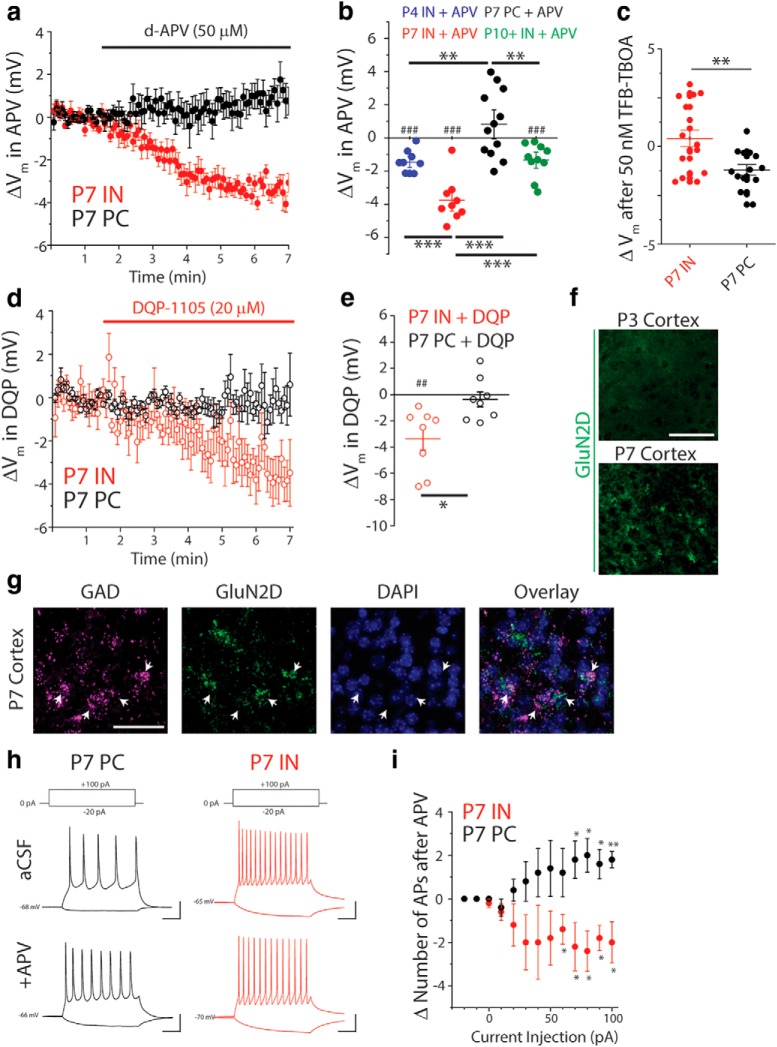
Figure 5.
INs are tonically depolarized by ambient glutamate acting at GluN2C/DRs in the neonatal cortex. a, Averaged, baseline-adjusted, current-clamp traces, binned in 5 s increments, from L5Ps (n = 12 cells/4 animals) and INs (n = 9 cells/3 animals) during application of APV (50 μm). Traces represent the change in resting membrane potential upon APV bath application (ΔVm). b, Total change in resting potential (ΔVm) upon APV application in INs ages P3–P4 (n = 9 cells/ 3 animals), P7–P8 (n = 9 cells/ 4 animals), and P10+ (n = 10 cells/3 animals), as well as for L5Ps at P7 (n = 12 cells/5 animals). ##p = 0.0025 (two-tailed t test). ###p < 0.001 (two-tailed t test). **p < 0.01 (one-way ANOVA with Tukey post hoc test). ***p < 0.001 (one-way ANOVA with Tukey post hoc test). Lines indicate mean ± SEM. c, Total change in resting potential (ΔVm) upon 50 nm TFB-TBOA application in INs (n = 17 cells/7 animals) and L5Ps (14 cells/6 animals) at P7. **p < 0.01 (two-sample t test). d, Averaged, baseline-adjusted, current-clamp traces, binned in 5 s increments, from L5Ps (n = 8 cells/3 animals) and INs (n = 8 cells/4 animals) during bath application of DQP (20 μm). Traces represent ΔVm upon DQP application. e, Change in resting membrane potential after application DQP-1105 to P7 INs (n = 8 cells/4 animals) and L5Ps (n = 8 cells/3 animals). ##p = 0.0053 (two-tailed t test). *p = 0.012 (two-sample t test). Lines indicate mean ± SEM. f, Images represent absence of GluN2D mRNA signal at P3 and presence at P7, as detected by FISH using tyramide signal amplification with fluorescein (green). g, Images represent GluN2D and GAD56/67 mRNA signals detected by FISH using tyramide signal amplification with fluorescein (green) and HNPP/Fast Red TR (magenta), respectively. Nuclei were stained with DAPI (blue). Scale bars, 40 μm. h, Representative traces from a P7 L5P and a P7 IN demonstrating responses to positive and negative current injections before (top) and after (bottom) application of APV. Calibration: x = 50 ms, y = 20 mV. i, For each current injection: #APs before APV; #APs after APV = ΔAP. *p < 0.05 (one-sample t test comparing mean to zero). **p = 0.0043 (one-sample t test comparing mean to zero). Data are mean ± SEM.

