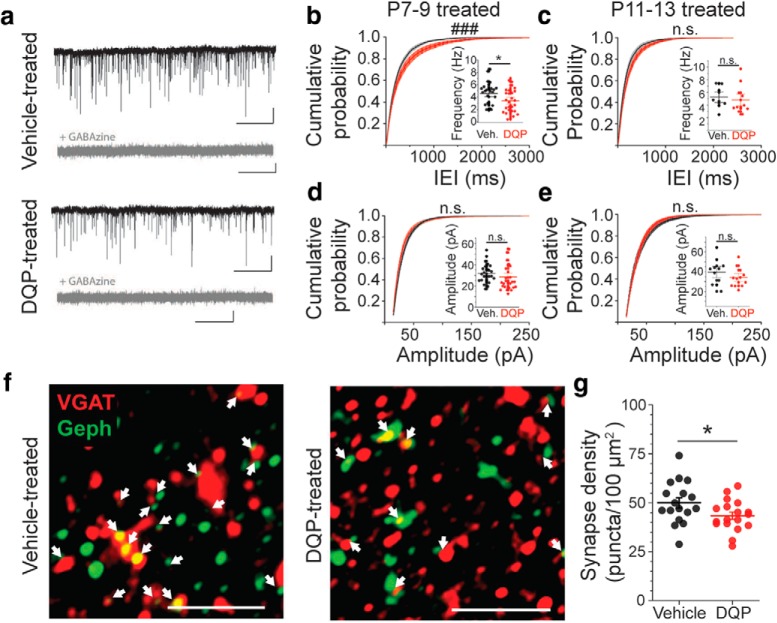
Figure 6.
In vivo blockade of GluN2C/D-containing NMDARs from P7–P9, but not P11–P13, causes long-term reductions in inhibitory synaptic activity and GABAergic synapse density. a, Representative mIPSC traces from animals treated with either DQP-1105 or vehicle at P7. mIPSCs are abolished by the application of GABAzine. Calibration: x = 10 s, y = 25 pA. b, Cumulative probability distribution (CPD) of mIPSC interevent intervals (IEIs) at P21 after treatment from P7–P9 with DQP-1105 (n = 27 cells/4 animals) or vehicle (n = 26 cells/4 animals). Inset, Average frequency. *p = 0.028 (two-sample t test). ###p = 5.0e-6 (two-sample Kolmogorov–Smirnov test). c, CPD of mIPSC IEIs at P21 after treatment from P11–P13 with DQP-1105 (n = 12 cells/2 animals) or vehicle (n = 11 cells/2 animals; p = 0.12, two-sample Kolmogorov–Smirnov test). Inset, Average frequency (p = 0.59, two-sample t test). d, CPD of mIPSC amplitudes at P21 after treatment from P7–P9 with DQP or vehicle (p = 0.48, two-sample Kolmogorov–Smirnov test). Inset, Average mIPSC amplitudes (p = 0.25, two-sample t test). e, CPD of mIPSC amplitudes at P21 after treatment from P11–P13 with DQP or vehicle (p = 0.089, two-sample Kolmogorov–Smirnov test). Inset, Average mIPSC amplitude (p = 0.25, two-sample t test). f, Enhanced-contrast z stack projection images showing colocalizaion of VGAT and Gephyrin staining at P21. Animals were treated with vehicle (n = 17 sections/7 animals) or DQP (n = 18 sections/7 animals) from P7–P9. Arrows indicate colocalization as identified in unprocessed z stack projection images. Scale bars, 2 μm. g, Quantification of the density of synapses. Circles represent synapse density in individual sections. Lines indicate mean ± SEM. *p = 0.046 (two-sample t test).

