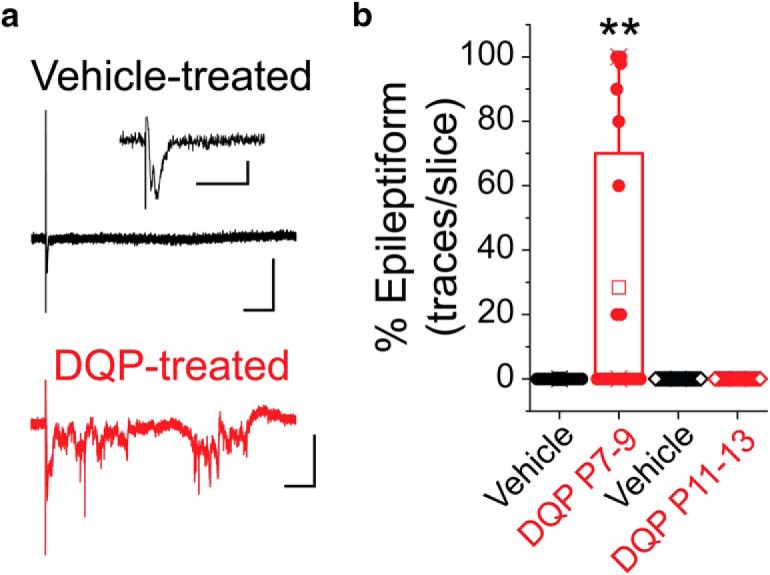
Figure 8.

In vivo blockade of GluN2C/D-containing NMDARs from P7–P9 leads to network hyperexcitability in the adult cortex. a, Representative cortical field potential traces from animals treated with DQP or vehicle from P7–P9. Calibration: x = 100 ms, y = 0.2 mV. Recordings were made at P21. The DQP-treated example trace represents epileptiform activity, which was only observed in animals treated with DQP from P7–P9. Inset (vehicle-treated panel), Magnified field potential. Calibration: Inset, x = 20 ms, y = 0.05 mV. b, Box-and-whisker plot showing the distribution of the percentage epileptiform traces in slices from each group at 2× threshold stimulation (P7–P9 DQP: n = 20 slices/3 animals; P7–P9 Veh: n = 17 slices/3 animals; P11–P13 DQP: n = 20 slices/3 animals; P11–P13 Veh: n = 20 slices/3 animals). Box boundaries mark quartiles. Filled circles represent data from individual slices. Open squares represent the mean for each group. **p = 0.0021 (Wilcoxon rank-sum test).
