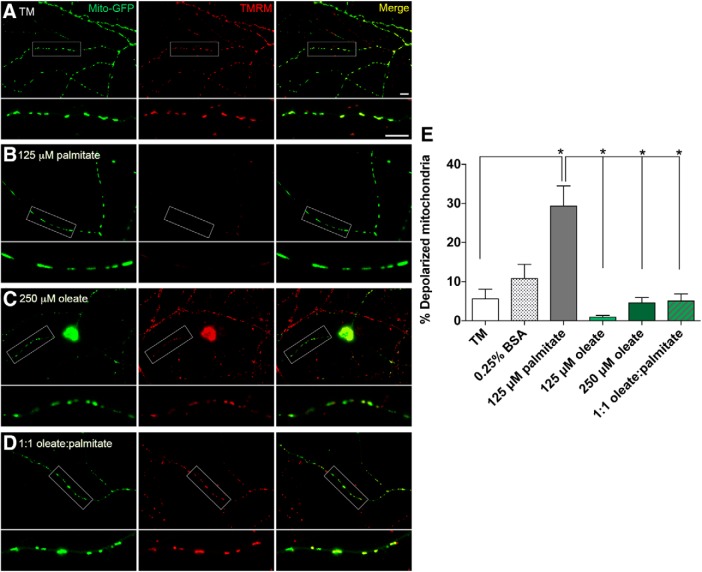
Figure 3.
MUFA treatment preserves and protects DRG neuronal MMP. Fluorescence microscopy imaging of DRG neurons expressing mito-GFP that were stained with TMRM dye specific for polarized mitochondrial membranes, following treatment with TM (A), 125 μm palmitate (B), 250 μm oleate (C), or a mix of 125 μm palmitate and oleate (D). Green signal (mito-GFP) indicates mitochondria, red signal (TMRM) indicates mitochondria with membrane potential, and yellow signal (Merge) shows overlap of mito-GFP and TMRM signals indicative of polarized mitochondria. Scale bars represent 10 μm. E, Percentage of depolarized mitochondria as shown in A–D; i.e., mitochondria fluorescing green (mito-GFP) but lacking red TMRM signal, as a percentage of total mitochondria. All data represent n = 31–35 neurons per condition: one-way ANOVA with Tukey's multiple-comparisons test. *p < 0.0001.

