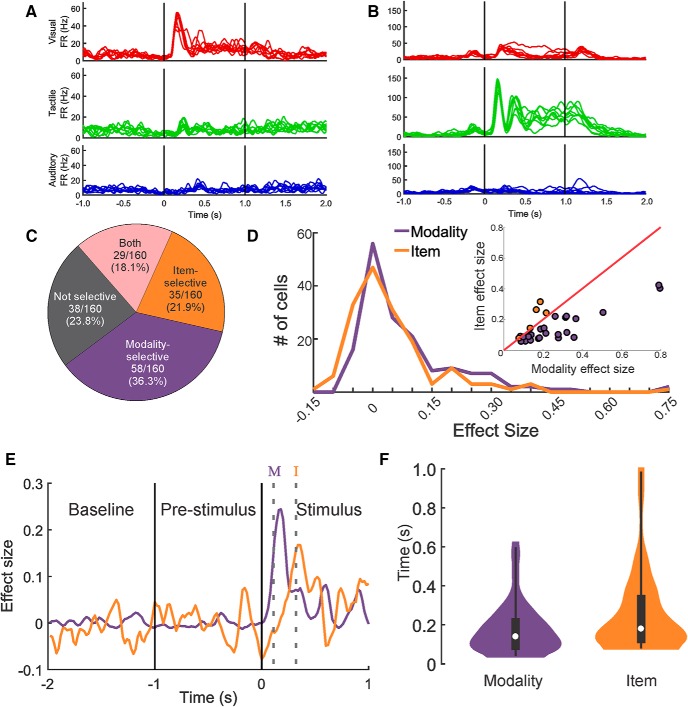
Figure 3.
Modality selectivity was more prominent than item selectivity and emerged earlier across the population of neurons. A, A modality-selective neuron with no item selectivity. Mean responses across 16 repetitions of each stimulus are plotted as individual spike density functions and overlaid by modality. B, A modality- and item-selective neuron that responded with large differences to stimulus modality. Smaller, but significant, differences in response to items within a modality were present as well (e.g., the elevated response to a single visual stimulus). C, Proportions of neurons classified as nonselective, modality-selective, item-selective, or both modality- and item-selective. D, Distributions of the effect sizes for modality and item selectivity for all responsive cells. Inset, Scatterplot represents the effect size for modality plotted against the effect size for item for all 29 modality- and item-selective neurons. Purple dots represent cells that had higher effect size for modality. Orange dots represent cells that had a higher effect size for item. E, Comparison of the effect sizes for modality and item over time for one example cell. Purple and orange solid lines indicate effect size over time for modality and item, respectively. Gray dotted lines indicate the time of the first significant bin for modality (purple M) and item (orange I). F, Distributions of the latencies to the first significant bin for modality and item. White circle represents the median. Black rectangle represents the inner quartile range. Thin black lines indicate the 1st to 99th percentile range. Modality selectivity arose earlier than item selectivity.

