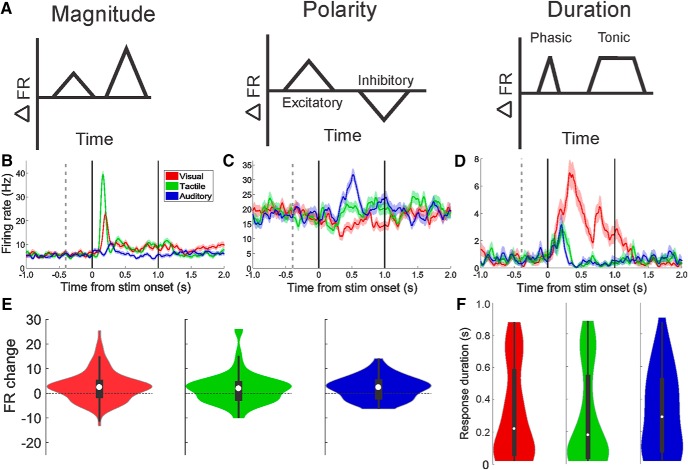
Figure 4.
Modality and item selectivity is expressed by changes of response magnitude, polarity, and duration. A, Simplified diagrams illustrating the three main spike-train metrics that differentiate between categories of stimuli and items within categories (Mosher et al., 2010). B–D, Examples of each type of spike-train modulation. Each neuron shown here responded to all three sensory domains. E, Distribution of response magnitudes for all responsive neurons. The number of excitatory responses was significantly higher than the number of inhibitory responses for all sensory domains, but no difference was present between domains. Violin plots use same conventions as in Figure 3F. F, The response duration for visual, tactile, and auditory stimuli shows no significant difference between the groups.

