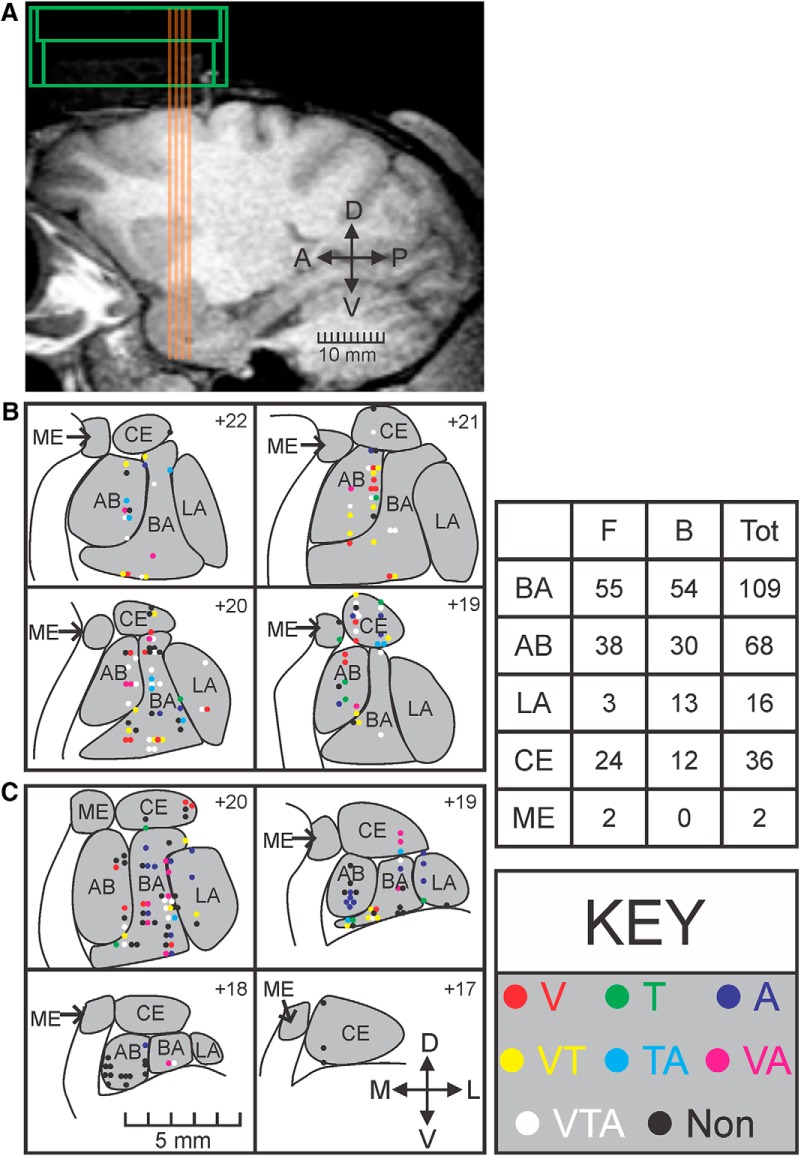
Figure 5.
Anatomical distribution of response type for all recorded cells. A, Sagittal section from the MRI of Monkey F showing the electrode tracks (orange lines) and chamber location (green). B, Anatomical reconstruction of each recorded cell for Monkey F. Each panel represents a coronal section of an MRI with the recorded cells for that anteroposterior position overlaid on top (approximate distance from interaural line shown in top right of each panel). Response types follow the same color code as in Figure 2. Gray represents amygdala nuclei. C, Anatomical reconstruction of each recorded cell for Monkey B. Bottom left, scale bar for all coronal sections. Bottom right, Arrows indicate mediolateral (M-L) and dorsoventral (D-V) axes. The table gives a numerical breakdown of the sampling from the 2 monkeys (Monkey F and Monkey B) from across the nuclei. BA, basal; AB, accessory basal; LA, lateral; CE, central; ME, medial.

