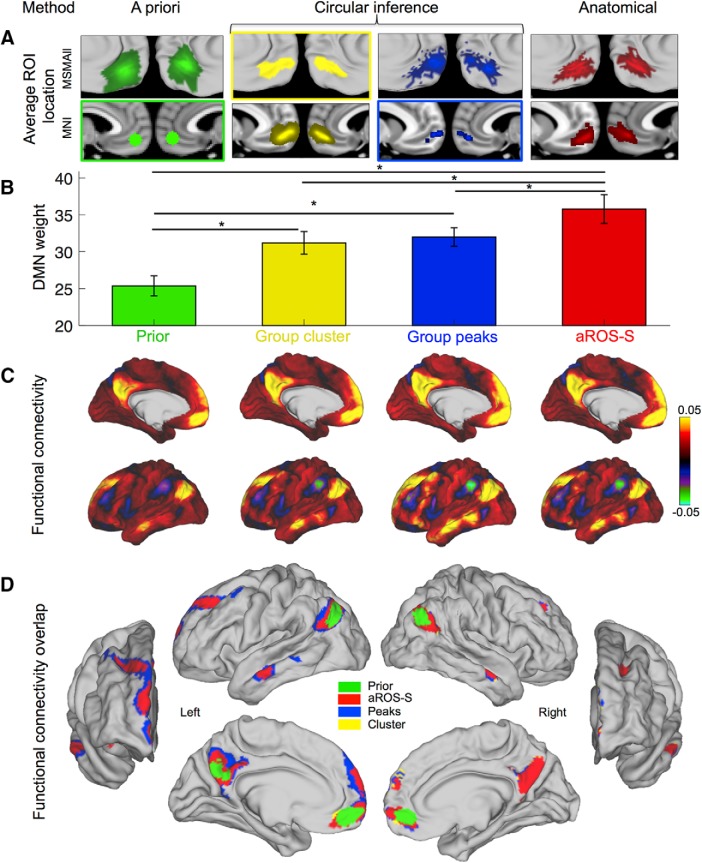
Figure 6.
Default Mode Network weights in four vmPFC ROIs. DMN results from ROIs defined according to four different methods: a priori MNI method (green, Prior), circular inference method, based on group results (cluster, yellow; peaks, blue), and anatomical method (aROS-S, red). A, Average ROI location across subjects on the MSMAll surfaces (top row) and in the MNI referential (bottom row). Colored rectangles indicate the referential of each ROI: MNI for Prior and Group peaks, vertices for Group cluster. There is no rectangle for the aROS-S because its referential is anatomical. B, Default Mode Network weights averaged across all hemispheres for each ROI. Error bars represent the SEM. Stars indicate significance. C, Mean functional connectivity map across left hemispheres for each ROI. Colors indicate average correlation coefficients. Right hemispheres have a similar profile and are not displayed for illustrative purposes. D, Overlap of the maps displayed in C but thresholded at 0.05. Maps were superimposed according to the extent of the cluster (smaller above). The maps are displayed for left and right hemispheres with anterior, lateral, and medial perspectives.

