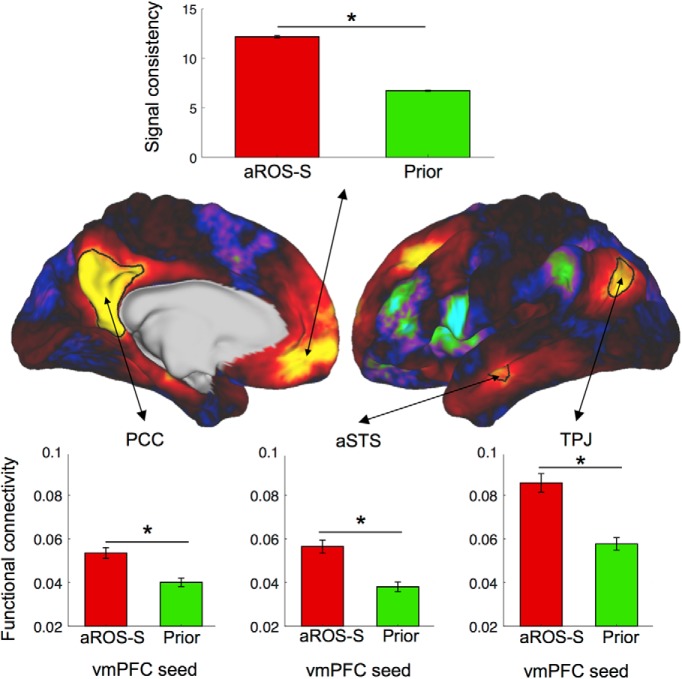
Figure 7.
Default Mode Network components comparison between prior and anatomical ROI. Top, Signal consistency within aROS-S and Prior ROI. Signal consistency is the inverse of the SD of the raw signal across vertices averaged across time. Middle, Average Default Mode Network weights across left hemispheres (right hemisphere not shown for illustrative purposes). The map was used to draw the PCC, aSTS, and TPJ regions of interest. Bottom, Average functional connectivity across all hemispheres between the vmPFC seed (aROS-S or Prior) and the PCC (left), the aSTS (middle), and the TPJ (right). Stars indicate significance (p < 0.05).

