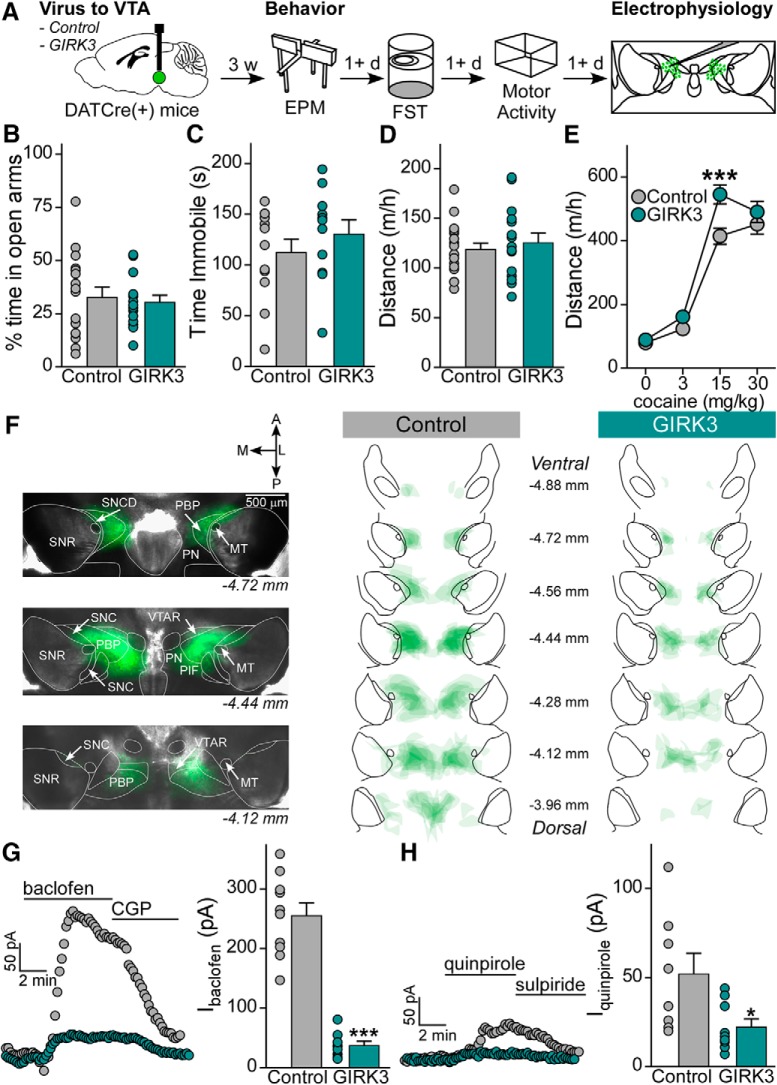
Figure 3.
Viral suppression of GIRK channel activity in VTA DA neurons increases behavioral sensitivity to cocaine. A, DATCre(+) mice were injected with control or GIRK3 virus. Mice were tested for EPM, FST, and cocaine locomotor activity 3 weeks after surgery, with each task separated by at least 1 d. Following behavior, mice were processed for placement and electrophysiology validation. B, EPM percent time in open arms is not different in control mice (n = 17, 33 ± 5%) and GIRK3 mice (n = 14, 30 ± 3%; t test, t(29) = 0.396, p = 0.695). C, FST time immobile during the final 4 min of the task does not differ between control mice (n = 12, 112 ± 13 s) and GIRK3 mice (n = 11, 131 ± 14 s; t test, t(21) = 0.957, p = 0.350). D, Distance moved on the handling habituation day was not different between control mice (n = 17, 119 ± 6 m/h) and GIRK3 (n = 15, 126 ± 9 m/h; t test, t(30) = 0.630, p = 0.534). E, Distanced traveled following injection of 0, 3, 15, and 30 mg/kg cocaine resulted in interaction between cocaine dose and virus (two-way repeated-measures ANOVA, F(3,90) = 3.438, p = 0.020; Bonferroni post hoc test at 15 mg/kg cocaine, t = 4.111, p < 0.001). F, Representative images of viral spread in horizontal slices from a mouse in the control condition, imaged at 2× just before electrophysiology, and summary of viral spread for all mice in control and GIRK3 conditions. MT, Medial terminal nucleus of the accessory optic tract; SNC, substantia nigra, compact part; SNCD, substantia nigra, compact part, dorsal tier; SNR, substantia nigra, reticular part; PBP, parabrachial pigmented nucleus of the VTA; PIF, parainterfascicular nucleus of the VTA; PN, paranigral nucleus of the VTA; VTAR, ventral tegmental area, rostral part. G, GABABR-GIRK currents in the GIRK3 group (n = 9 cells from 8 mice, 38 ± 7 pA) are significantly smaller than those in the control virus condition (n = 10 cells from 6 mice, 255 ± 21 pA; Mann–Whitney U test, U = 0.0, p < 0.0001). H, D2R-GIRK currents in the GIRK3 group (n = 9 cells from 7 mice, 22 ± 4 pA) are significantly smaller than those in the control virus condition (n = 8 cells from 6 mice, 52 ± 12 pA; Mann–Whitney U test, U = 11.50, p = 0.021). *p < 0.05. ***p < 0.001.

