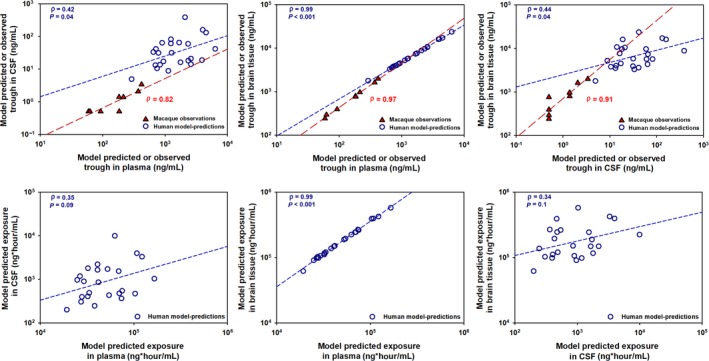
Figure 4.

Correlation analysis between model‐predicted efavirenz concentration at 24 hours (C24h) postdose and area under the concentration‐time curve (AUC) in the plasma, cerebrospinal fluid (CSF), and brain tissue in humans and observed concentrations at 24 hours in macaques. The open circles represent the predicted C24h and AUC parameters in humans, whereas the filled triangles (and long dashes) represent observed C24h in the rhesus macaques. Brain tissue C24h and AUC parameters showed better correlation with the plasma parameters (γ = 0.99, P < 0.001 and γ = 0.99, P < 0.001) than with the CSF parameters (γ = 0.44, P = 0.04 and γ = 0.34, P = 0.1).
