
Figure 4.
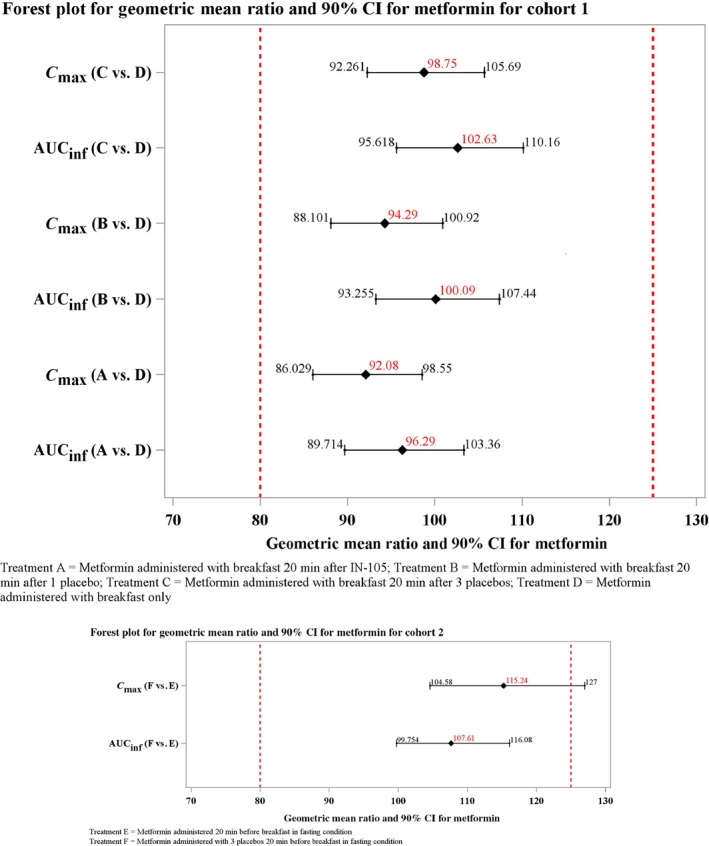
Geometric mean ratio and 90% confidence interval (CI) for metformin in cohorts 1 and 2. AUC, area under the curve; AUCinf, AUC from time zero to infinity; Cmax, peak plasma concentration IN‐105, insulin tregopil.
Official websites use .gov
A
.gov website belongs to an official
government organization in the United States.
Secure .gov websites use HTTPS
A lock (
) or https:// means you've safely
connected to the .gov website. Share sensitive
information only on official, secure websites.
Geometric mean ratio and 90% confidence interval (CI) for metformin in cohorts 1 and 2. AUC, area under the curve; AUCinf, AUC from time zero to infinity; Cmax, peak plasma concentration IN‐105, insulin tregopil.