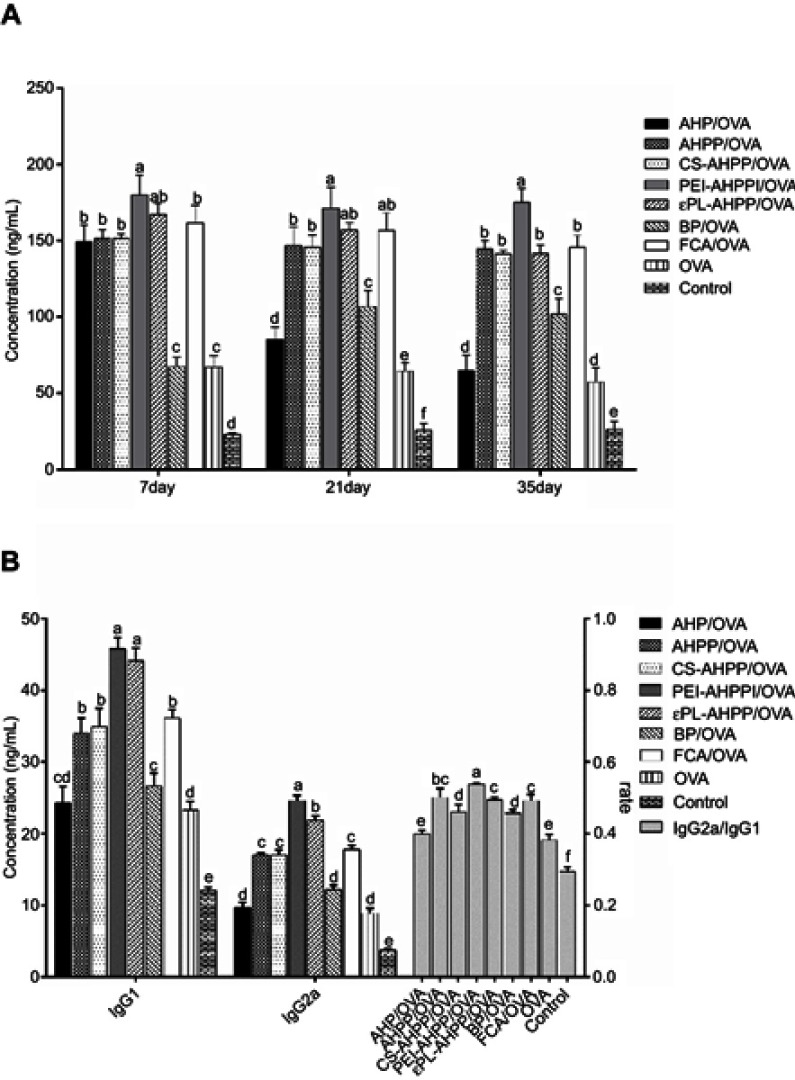
Figure 5.
(A) OVA-specific IgG levels at the indicated time points. (B) Th2-associated isotype IgG1 levels, Th1-associated isotype IgG2a levels, and ratio of IgG2a/IgG1 at day 35 after final vaccination. Mice (n=4) were immunized using different vaccine formulations. a–f Bars with different superscripts differed significantly (P<0.05).

