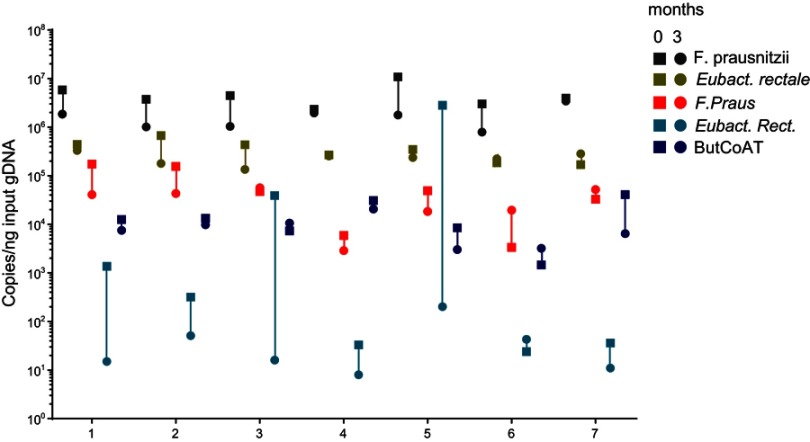
Figure 3.
Longitudinal analysis of the most abundant butyrate-producing species and the BCoAT gene in healthy volunteers. Longitudinal analysis of 7 healthy volunteers, numbered 1–7. Copy numbers/nanogram input gDNA of the total amount of bacterial DNA (16S), the three most abundant butyrate-producing species and the BCoAT gene. Squares represent the first measured time point for each of the individuals, circles the second time point three months later.

