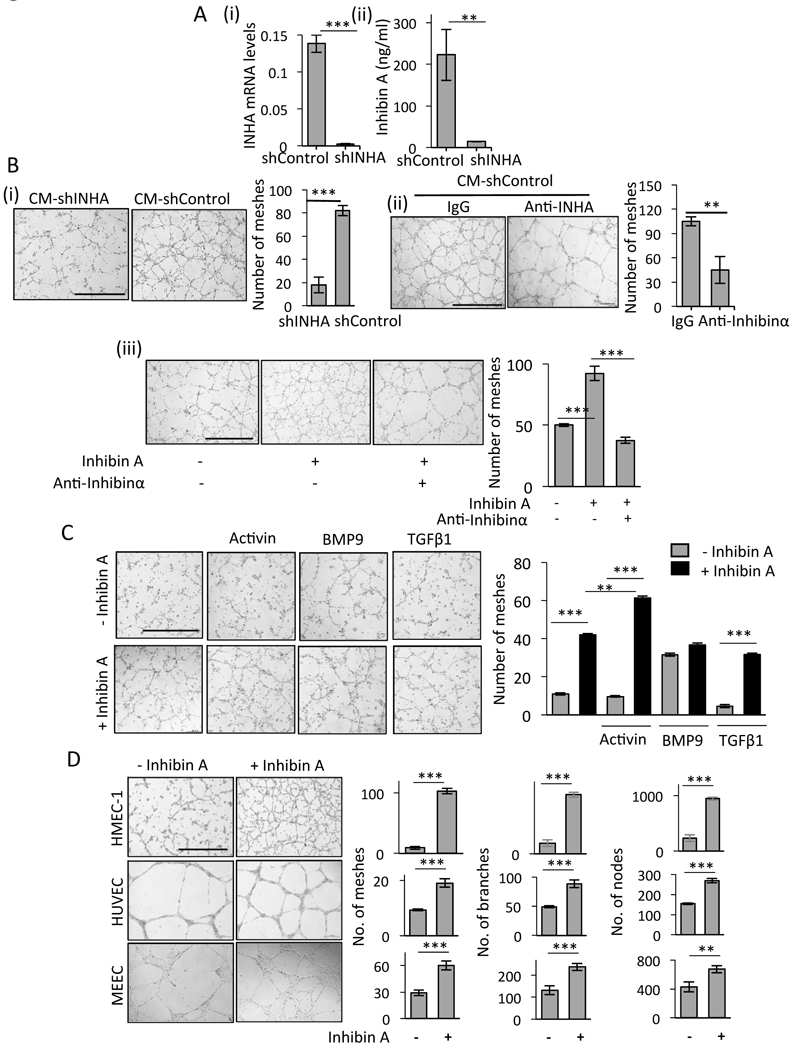
Figure 2: Inhibin increases endothelial cell tubulogenesis.

(A) (i) INHA mRNA levels in stable SKOV3 shControl and shINHA cancer cells (Methods). (ii) ELISA for total Inhibin (Inhibinα, InhibinA/B) from shControl and shINHA SKOV3 CM. (B) Tube formation of HMEC-1 cells in the presence of (i) CM from shControl SKOV3 cancer cells or shINHA SKOV3 cells (ii) and 10 μg/ml anti- Inhibinα or IgG control or (iii) treated with 300 pM recombinant Inhibin A alone or in the presence of anti-Inhibinα antibody (10 μg/ml). Bar graphs represent the average number of meshes quantified and represents an average of independent trials (Methods). mean ± SEM, ***P<0.001 and **P<0.01, Student’s t-test. Scale bar=500 μm. (C) HMEC-1 treated with equimolar amounts (300pM) of indicated TGF-β members either alone or in combination with Inhibin A. Bar graph represents quantitation as in B. One way ANOVA, Tukey’s multiple comparison test ***P<0.001 and **P<0.01. (D) Tube formation of HMEC-1, HUVEC and MEEC cells upon treatment with 300 pM Inhibin A for 16 h. Graph represents number of meshes, branches and nodes (Methods). mean ± SEM, ***P<0.001 and **P<0.01, Student’s t-test. Scale bar=500 μm
