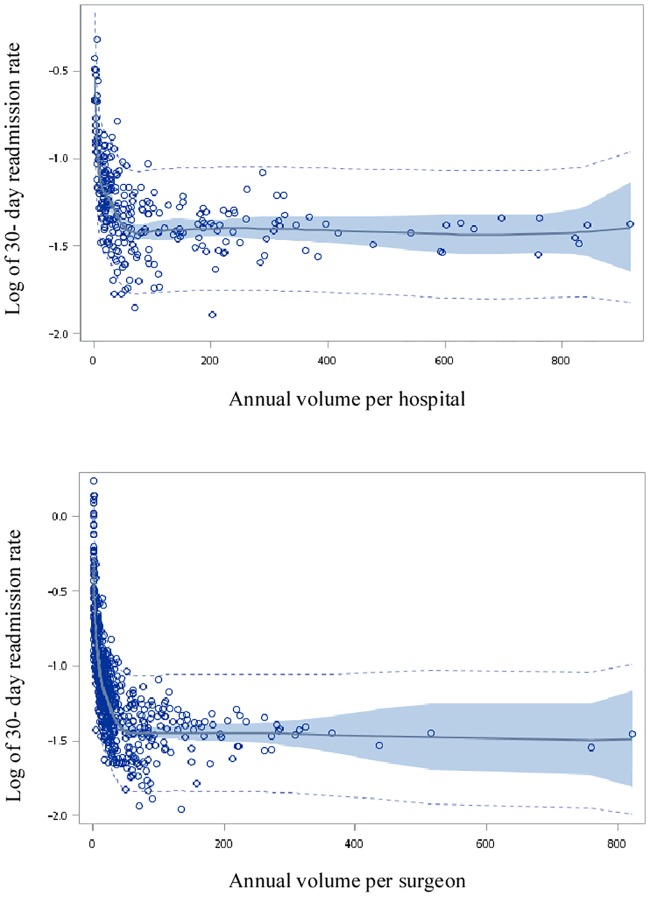
Fig 1. Restricted cubic spline plot of the adjusted log of the 30-day readmission rate versus annual total knee replacement volume performed per hospital and per surgeon.
Note: The light dotted curve presents the 95% confidence intervals for the predicted limits. The dark line presents the fit regression model. The dark area presents the 95% confidence intervals for the regression limits.

