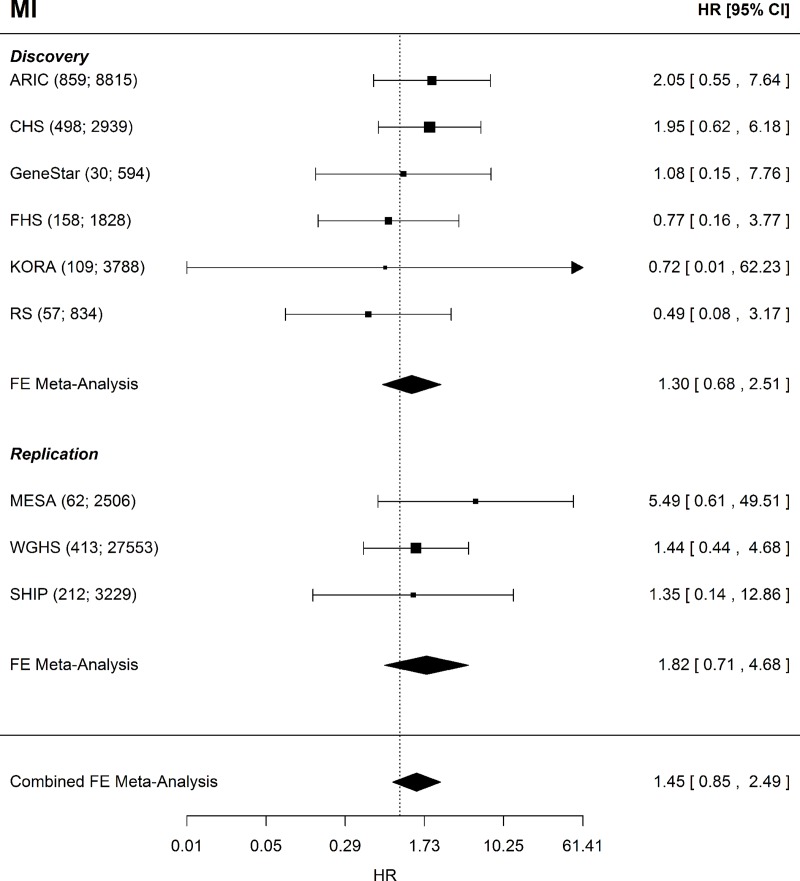
Fig 2. MI Forest plot.
Forest plot of the MI MR analysis for the discovery, replication, and combined sets of cohorts. Shown beside each cohort name is the sample size and number of incident MI events given as (N events; N total). MI = myocardial infarction, FE = fixed-effects, HR = hazard ratio, CI = confidence interval.

