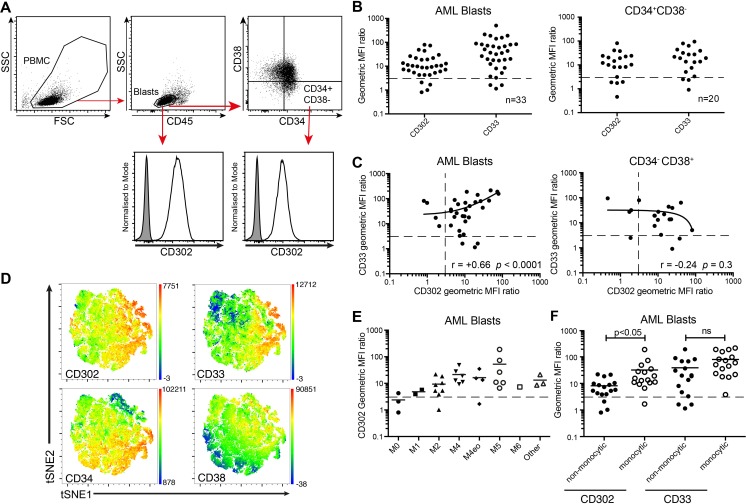
Fig 1. Expression of CD302 on leukemic blasts, CD34+CD38- LSC and HSC.
(A) Gating strategy used to identify CD45loSSClo AML blasts and CD34+CD38- LSC. (B) Scatter dot plots showing the CD33 and CD302 expression on AML blasts (n = 33) and LSC fraction (n = 20). Samples were stained with MMRI-20 and CD33 mAb. Populations with a geoMFI ratio ≥3, shown above the dotted line, were considered to be positive. (C) Relationship between mean CD33 and CD302 expression on AML blasts and on AML LSC from patients. The solid lines were generated by linear regression. (D) Six parameter data (including CD117, CD34, CD33, CD38, CD45 and CD302) from five concatenated AML patient samples was converted into two t-SNE dimensions and overlayed with heatmaps of the indicated marker’s MFI. (E) Summary of CD302 expression by AML blasts across FAB subtypes based on their morphology and immunophenotypic characteristics, as outlined in the 2008 WHO classification. (F) CD302 and CD33 expression on AML samples with monocytic differentiation, FAB subtype M4 and M5, were compared to other subtypes of AML.

