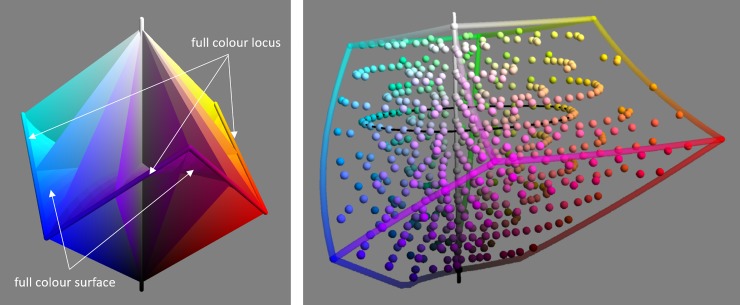
Fig 1.
Illustrates the sRGB (left) and CIELAB (right) colour spaces. Left: the achromatic axis (vertical) and the full colour locus (non-planar hexagon) are marked by tubes. A selection of hue triangles span from the achromatic axis to the full colour locus. The curved full colour surface, bordered by the full colour locus, can just been seen. Right: the extent of the sRGB cube is shown in CIELAB space. The colours for which naming data was collected (section 2) are shown by spheres. The thin black horizontal ring marks a path which is analysed in section 5 Fig 8.

