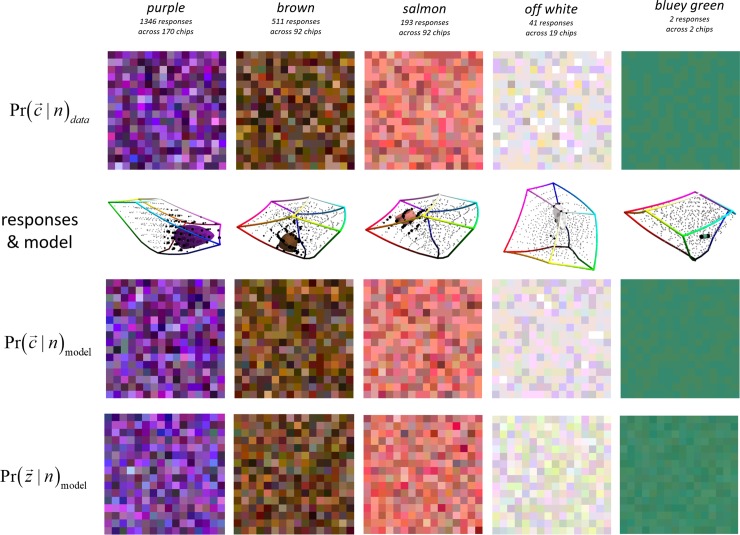
Fig 7. Each column shows the data and model for a different name n (shown in the top row).
2nd row: samples from the distribution of chips causing naming response n. 3rd row: the CIELAB locations of the chips causing response n are shown as black spheres, with volume proportional to the response fraction for that chip; other chips are shown as smaller grey spheres; the one sd limit of the fitted covariance is also shown. 4th row: like the 2nd row but according to the fitted model rather than direct from the data. 5th row: generalization of the 4th row from the 600 chips used as experimental stimulus to the full colour gamut.

