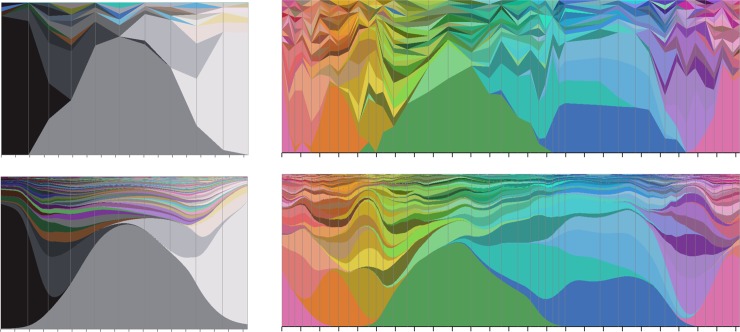
Fig 8.
Left: Visualizations for a path along the achromatic axis. Right: for a circular path around the achromatic axis (see Fig 1 right). Top: Response distributions, piecewise linearly interpolated along sRGB paths, tied to observed response distributions at chip locations marked by grey vertical lines. Bottom: modelled response distributions along the same paths. In all panels the tick marks along the horizontal axis have spacing Δ = 0.1 (sRGB units), the smoothness length scale used in section 6. Vertical sections show proportions of naming responses (each colour corresponds to a different name) as in Figs 2 and 3.

