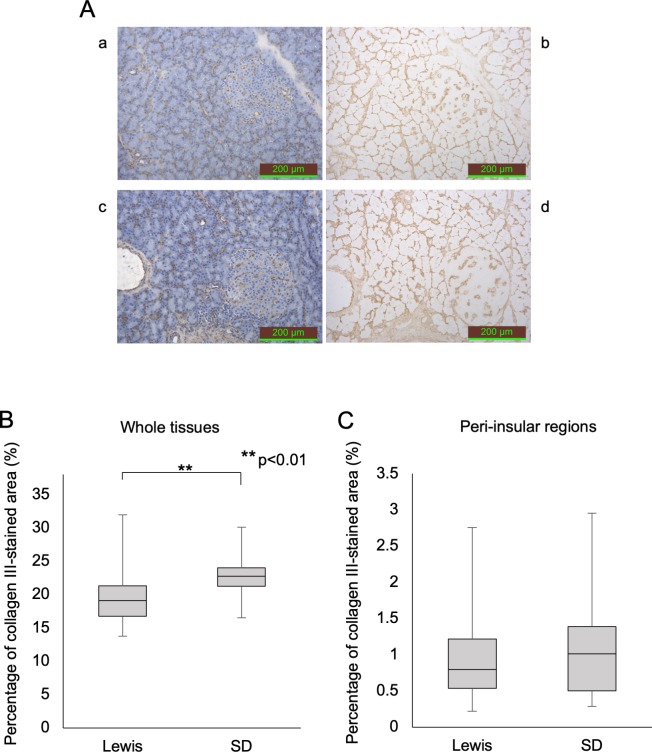
Fig 2. Anti-collagen III staining of the pancreatic tissues in each rat strain.
(A) Anti-collagen III staining (a and b: Lewis rat; c and d: SD rat). The stained area was calculated using pictures without hematoxylin staining (b, d). (B) The percentage of the over-all anti-collagen III-stained area. (C) The percentage of the anti-collagen III-stained area in the peri-insular region only.

