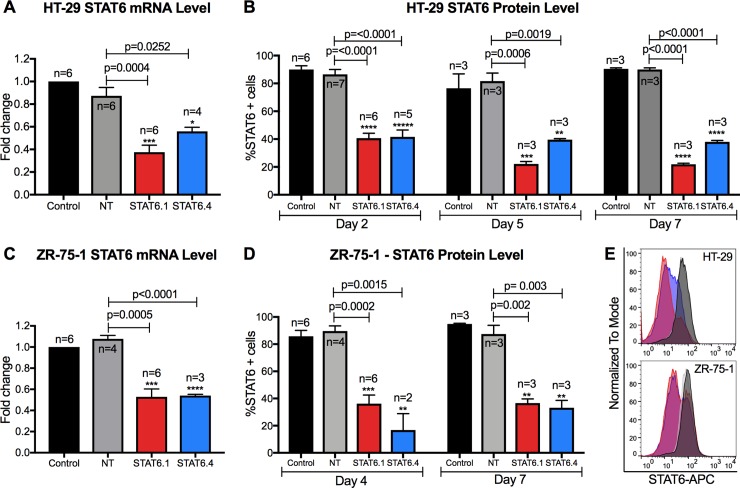
Fig 1. STAT6 siRNA sequences 1 and 4 significantly block STAT6 expression.
(A) Measure of STAT6 mRNA level in HT-29 cells 24 hours post-transfection. The graph represents the mean ± SEM of multiple independent experiments (n) obtained by real-time PCR. Results were analysed by ΔΔCt method for relative quantifications. The fold change is represented by the Y axis, and values are normalized to control cells. (B) STAT6 protein level analysis at 2, 5 and 7 days post-transfection in HT-29 cells. The graph represents the mean of the percentage of STAT6 positive cells ± SEM of multiple independent experiments (n) obtained by flow cytometry. (C) Measure of STAT6 mRNA level in ZR-75-1 cells 3 days post-transfection. The graph represents the mean ± SEM of multiple independent experiments (n) obtained by real-time PCR. Results were analysed by ΔΔCt method for relative quantifications. The fold change is represented by the Y axis, and values are normalized to control cells. (D) STAT6 protein level analysis after 4 and 7 days of transfection in ZR-75-1 cells. The graph represents the mean of the percentage of STAT6 positive cells ± SEM of multiple independent experiments (n) obtained by flow cytometry. E) Representative histograms (Control: back; NT: grey; STAT6.1: red; STAT6.4: blue) of STAT6 protein analysis at 7 days post-transfection by flow cytometry in HT-29 cells (top) and ZR-75-1 (bottom) cells. STAT6 siRNA sequences and non-targeting siRNA were used at 100 nM as the final concentration. Control cells were non-transfected cells and STAT6 siRNA sequences 1 and 4 and non-targeting siRNA are denoted as STAT6.1, STAT6.4 and NT, respectively. The number of independent experiments (n) is set out in the Fig.

