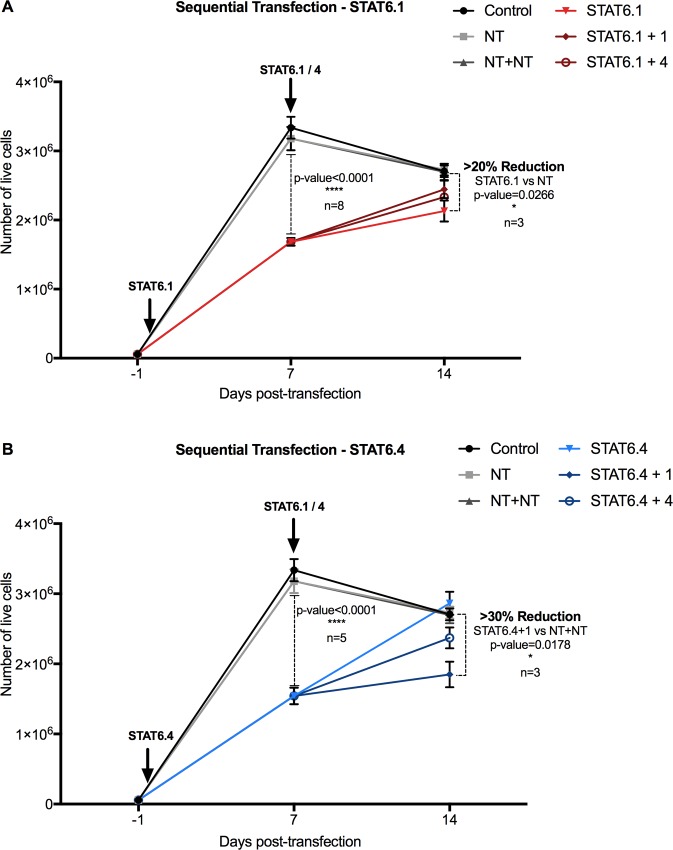
Fig 4. STAT6 siRNA sequential transfection is effective in maintaining a reduced number of HT-29 cells.
STAT6 siRNA transfection was carried out at day 1 of cell culture with (A) STAT6.1 and (B) STAT6.4 at 100 nM. A second transfection was carried out in both cases with STAT6.1 and STAT6.4 at the same concentration 7 days after the first transfection. The graphs represent the number of live cells over time measured at day 7 and 14 days post-first transfection counted using NucleoCounter NC-100 as detailed in the material and methods section. The mean ± SEM of 3 independent experiments is represented in each graph. Control cells were non-transfected cells and STAT6 siRNA sequences 1 and 4 and non-targeting siRNA are denoted as STAT6.1, STAT6.4 and NT, respectively. The percentage of reduction of the number of live cells was calculated by comparison between the mean of NT vs. the mean of the individual transfection with STAT6 siRNA sequences, and sequential transfection with NT (NT+NT) vs. sequential transfection with STAT6.1 and STAT6.4.

