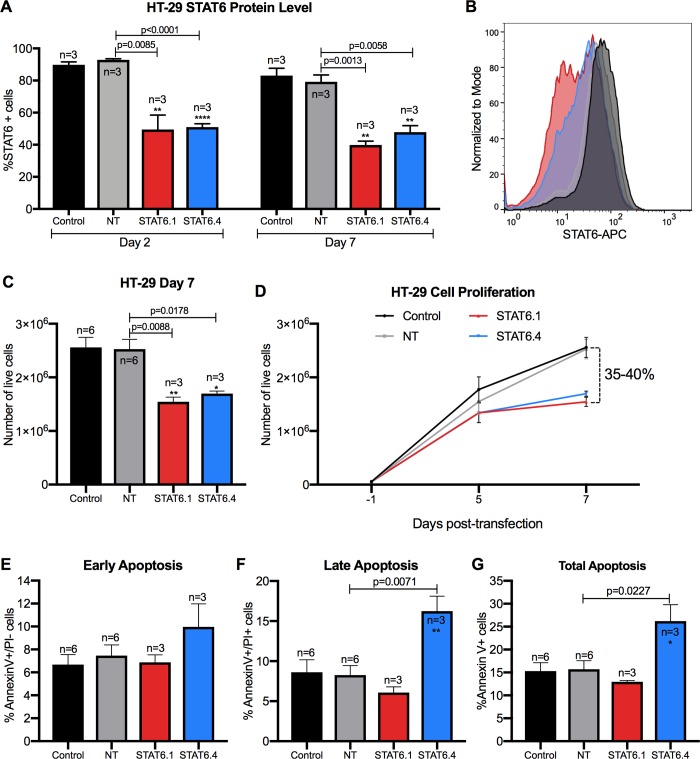
Fig 5. JetPEI transfection reagent works for transfecting efficiently STAT6 siRNAs in vitro.
(A) STAT6 expression at protein level in HT-29 cells at day 2 and 7 post-transfection measured by flow cytometry. The graph represents the mean ± SEM of multiple independent experiments (n). Data was analysed using Flowjo Software. The percentage of STAT6 positive cells is represented on the Y axis. (B) Representative histograms (Control: back; NT: grey; STAT6.1: red; STAT6.4: blue) of STAT6 protein analysis at 7 days post-transfection by flow cytometry in HT-29 cells. (C) Number of live HT-29 cells measured at day 7 post-transfection by NucleoCounter NC100. The graph represents the mean ± SEM of multiple independent experiments (n). (D) The graph illustrates how HT-29 cells grew over time and represents the mean ± SEM of the independent number of experiments shown in C. (E, F and G) The graphs show early (E) (Annexin V+/PI-), late (F) (Annexin V+/PI+) and total (G) (Annexin V+) apoptosis, and represent the mean ± SEM of multiple independent experiments (n) obtained by flow cytometry. Apoptosis was studied at 7 days post-transfection. Data were analysed with Flowjo Software. STAT6 siRNA sequences and a non-targeting siRNA sequence were used at 100 nM as the final concentration. Non-transfected cells served as control cells and STAT6 siRNA sequences 1 and 4 and non-targeting siRNA are denoted as STAT6.1, STAT6.4 and NT, respectively. The number of independent experiments (n) is set out in the Fig.

