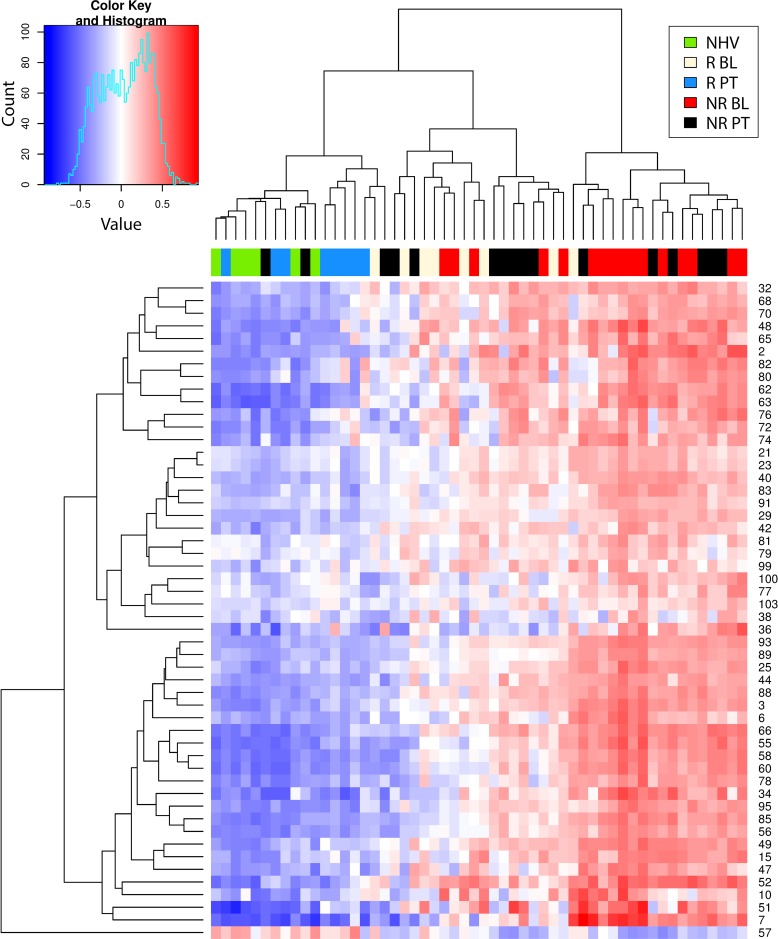
Fig 4. Hierarchical clustering heat map of gene set variation analysis enrichment scores of ulcerative colitis participant samples.
Shown is the heat map resulting from the hierarchical clustering of the gene set variation (GSVA) enrichment scores (ES) of ulcerative colitis (UC) participant samples (GSE16879) using all signatures significantly enriched from comparing CD post-treatment (PT) vs baseline (BL) in clinical responders (R) and non-responders (NR) as well as comparing R to NR at BL from Fig 2.

