Figure 5.

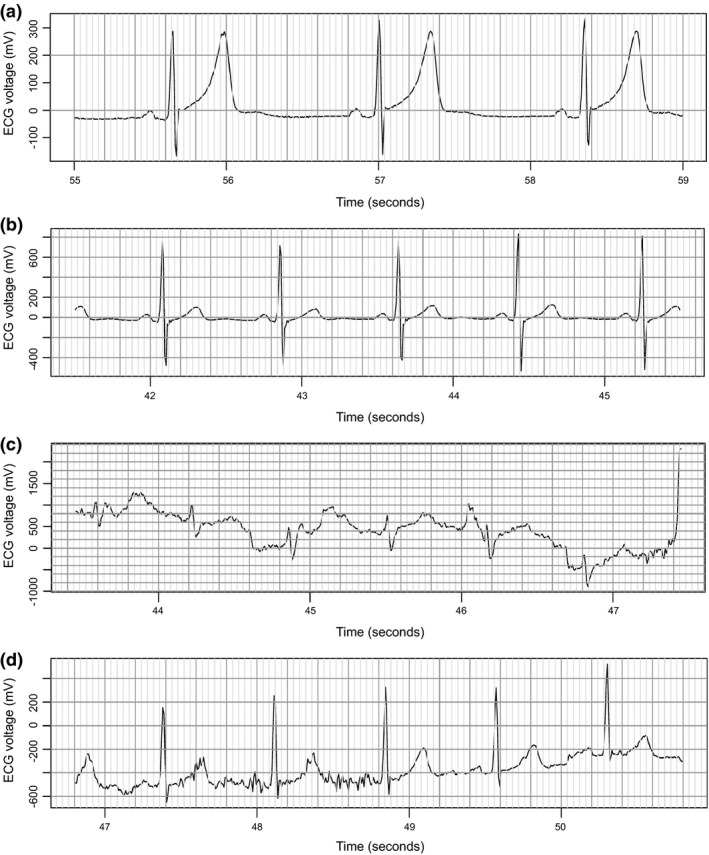
Visual examination of the echocardiogram (ECG) waveforms for episodes with reported heart rates of 44 bpm (a), 79 bpm (b), 203 bpm (c), and 193 bpm (d), bpm, beats/min.

Visual examination of the echocardiogram (ECG) waveforms for episodes with reported heart rates of 44 bpm (a), 79 bpm (b), 203 bpm (c), and 193 bpm (d), bpm, beats/min.