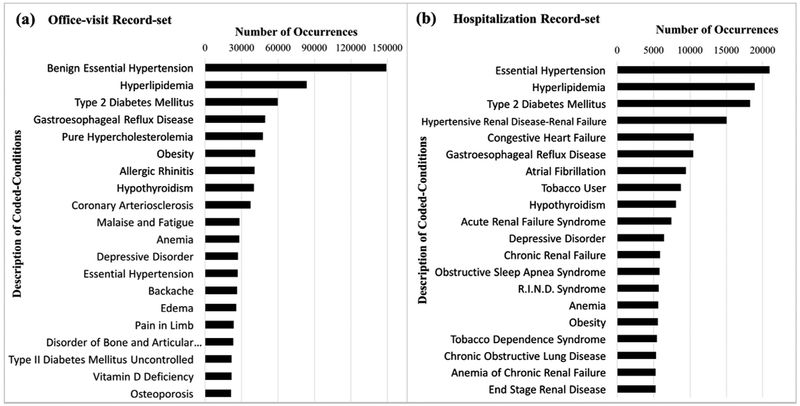
Fig. 1.
Number of occurrences of the twenty most frequent conditions in the office visit record set (a) and in the hospitalization record set (b). Each bar represents the number of occurrences of each condition in the respective record set. For clarity, we show the descriptive name associated with each SNOMED code rather than the code itself.

