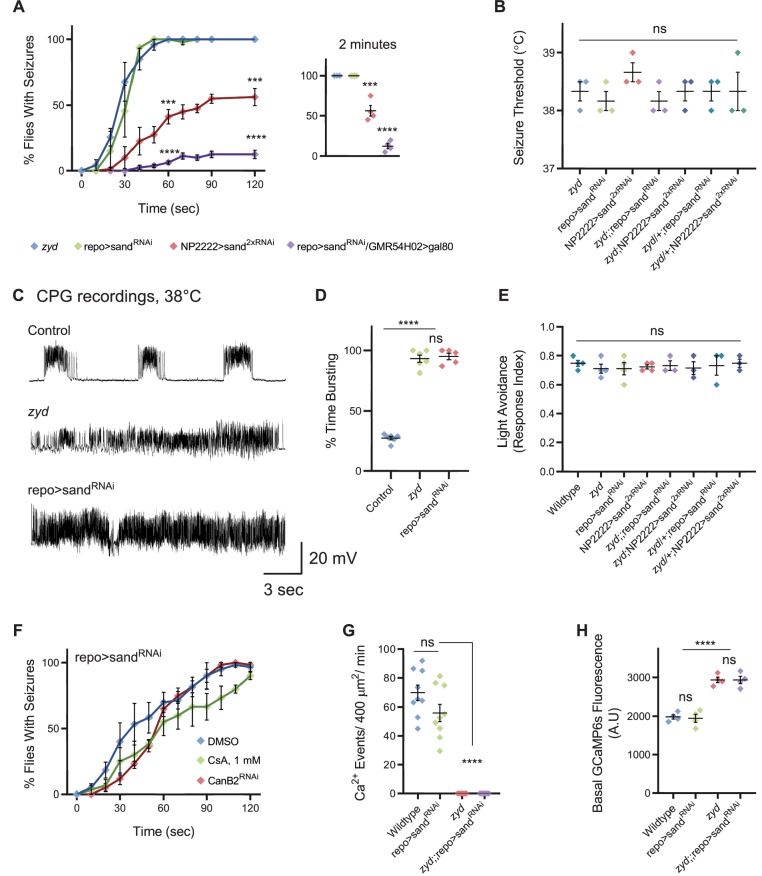
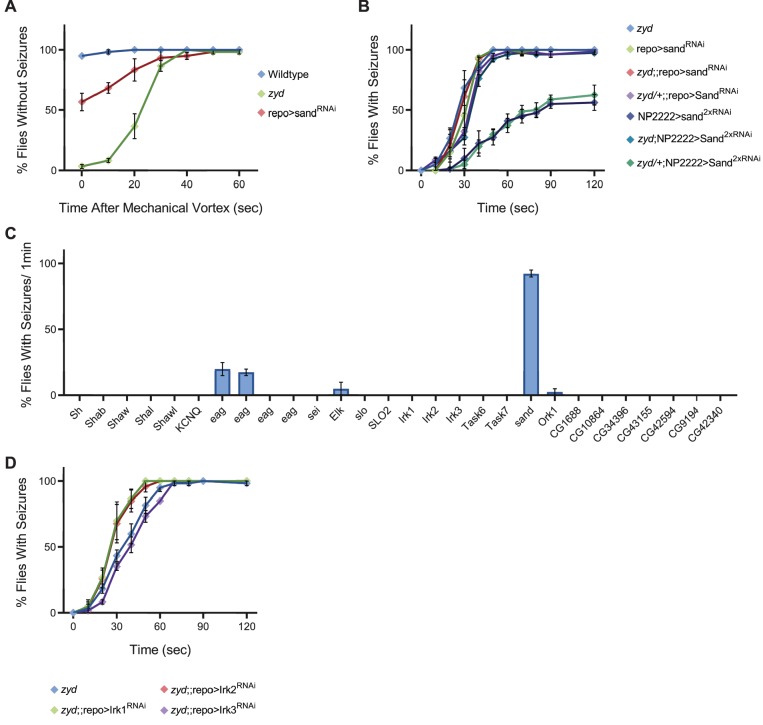
Figure 5. Cortex glial knock-down of sandman, a K2P channel, recapitulates zyd phenotypes.
(A-B) Behavioral analysis of HS induced seizures. (A) Knockdown of sandman (sand) in different glial subtypes: pan-glial (repo), cortex glial (NP2222) and in all glia other than cortex glia (repo>sandRNAi/GMR54H02>gal80 in which gal80 is constitutively inhibiting gal4 activity and sandRNAiexpression only in cortex glia). Inset shows analysis after 2 minutes of HS (p=0.0006 for NP2222>sand2xRNAi, p<0.0001 for repo>sandRNAi/GMR54H02>gal80, N = 4 groups of >10 flies/genotype). (B) Temperature threshold of repo>sandRNAi (p=0.5185) and NP2222>sand2xRNAi (p=0.2302) seizures in comparison to zyd (N = 3 groups of 10/temperature/genotype). (C) Representative voltage traces of spontaneous CPG activity at larval 3rd instar muscle 6 at 38°C in wildtype, zyd and repo>sandRNAi (n ≥ 5 preparations/genotype). (D) Quantification of average bursting duration for CPG recordings of the indicated genotypes at 38°C. (E) Light avoidance assay reveals no defect in this behavior at 25°C (N = 3 groups of 20 flies/genotype). (F) Behavioral analysis of HS-induced seizures. Seizures in repo>sandRNAi animals were not suppressed with either CanB2RNAi#1 or by feeding flies with 1 mM CsA (N = 3 groups of 20 flies/genotype/treatment). (G-H) Ca2+ imaging in larval cortex glial cells using myrGCaMP6s. (G) The average rate of microdomain Ca2+ events was reduced in repo>sandRNAi cortex glia relative to wildtype (20.36 ± 5.5 and 69.83 ± 5.3, p<0.0001). Knockdown of sand on the zyd background did not restore zyd Ca2+ microdomain events (n ≥ 5 animals/genotype). (H) Average myrGCaMP6s fluorescence in cortex glia at 25°C. Elevated basal fluorescence of GCaMP6s in zyd relative to wildtype cortex glia (p=0.0003) is not altered following sand knockdown (zyd;;repo>sandRNAi, N = 4 animals/genotype). Error bars are SEM, ***=P < 0.001, ****=P < 0.0001, Student’s t-test.


