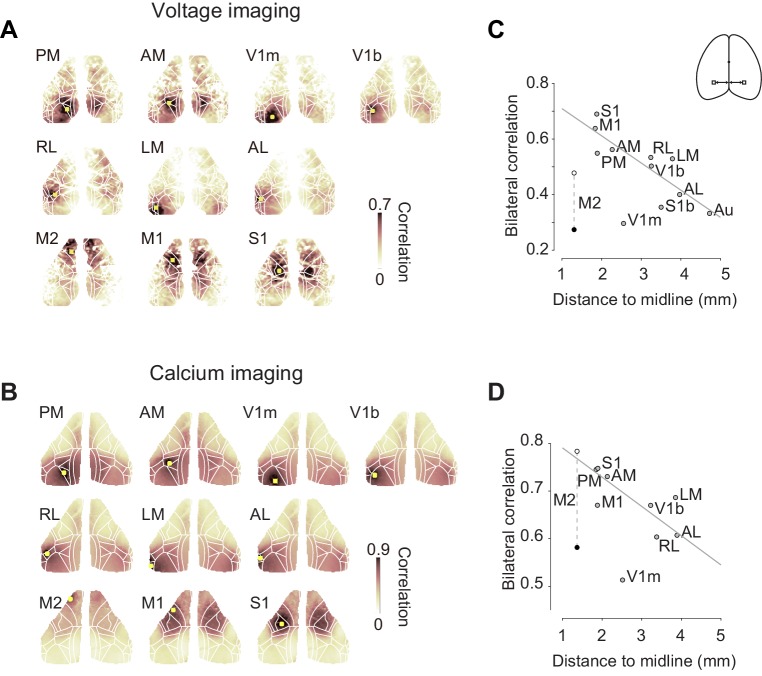
Figure 2. Bilateral fluctuations differ across areas.
(A) Seed-area maps of correlation from an example animal expressing a voltage indicator. Correlation was computed against the average signal within the red square to signals of the all the other pixels. (B, as in A), for an animal expressing a calcium indicator. (C) Correlation between left and right symmetrical ROIs (Regions of interest), as a function of distance ROI and the midline. Each dot represents average of two mice expressing voltage indicators. Data for area M2 is shown during passive (white) and active (black) conditions. Data for other areas are averages of active and passive conditions (gray). Gray line indicates a result of linear fit without using M2 and V1m. (D) Same as (C), for four mice expressing a calcium indicator.


