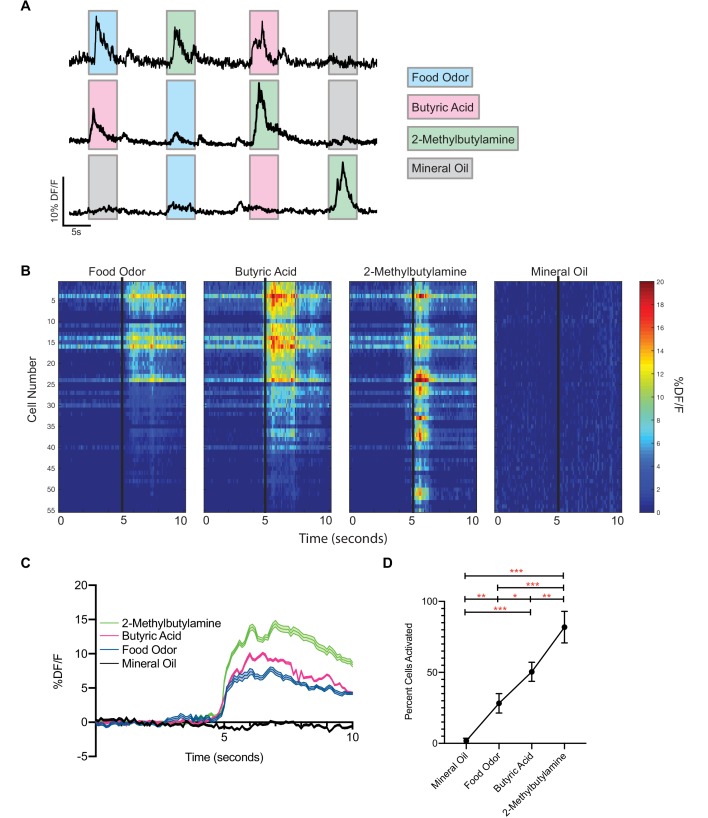
Figure 5. vGlut2BF neurons are activated by aversive odorants.
(A) Example calcium traces from vGlut2BF neurons to different odors presented for 5 s each. (B) Representative heat map of all cells recorded from one animal showing % DF/F responsivity to different odors over a 10 s window. (C) Combined calcium fluorescence activity from n = 5 mice showing neuronal activation to different odors (p<0.05 2-way ANOVA with post-hoc Tukey’s) (64 mineral oil cells, 142 food odor cells, 168 butyric acid cells, 310 2-methylbutylamine cells). (D) Percent cells activated in each animal to different odors n = 5 mice. *p<0.05, **p,0.01, ***p<0.001, RM one-way ANOVA with Tukey’s post-hoc analysis.

