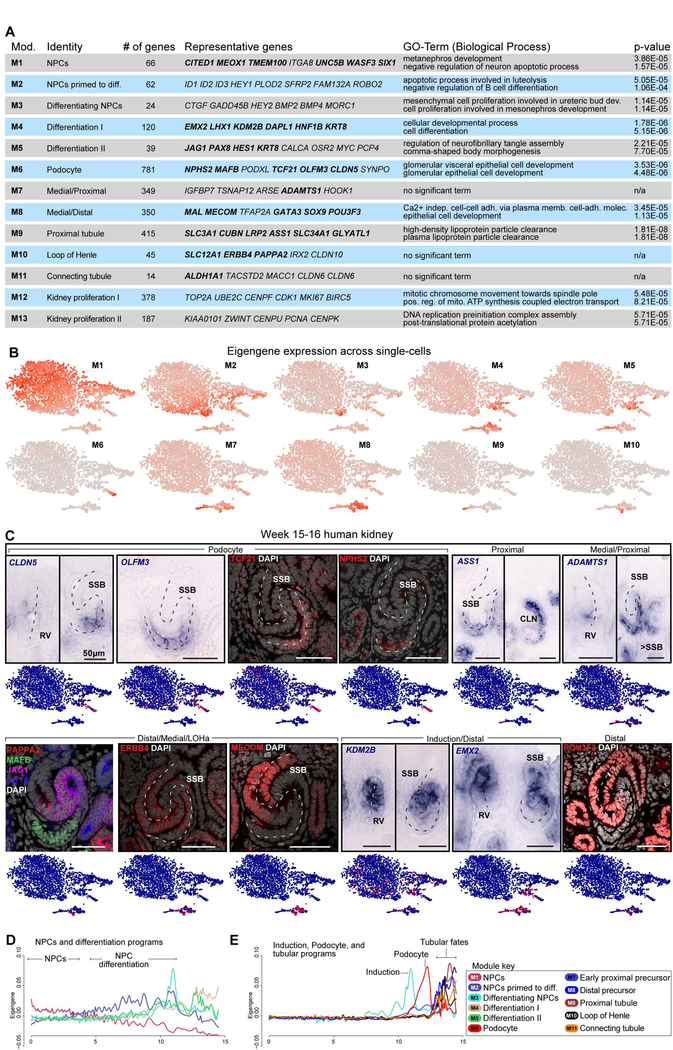
Fig. 3. Gene correlation networks demark nephron segment fates along temporal trajectories.
(A) Gene modules with representative genes highlighted, validated genes in bold, and GO-term analyses. (B) Eigengene expression across single cells. (C) Genes and proteins validated by in situ hybridization and immunofluorescent stains. Dashed line indicates axis of RV or SSB. (D-E) Module-specific smooth spline fitting of the relationship between pseudotime values inferred from Monocle2 as shown in Fig.2D:Path1 and eigengene expression in each single-cell. Pseudotime on the x-axis and eigengene expression on the y-axis. NPC: nephron progenitor cell, RV: renal vesicle, SSB: S-shaped body nephron, LOH: loop of Henle anlagen, CLN: Capillary loop stage nephron, Diff: differentiated. See also Supplementary figure 4.

