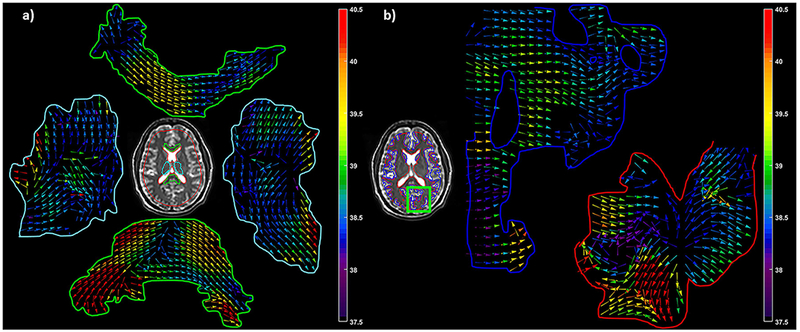
Figure 3:

Axial slice from one of the volunteers showing ROI for corpus callosum in green, thalamus in cyan and whole brain in red in (a). A small part of the brain is highlighted in green rectangle showing white matter in red and gray matter in blue (b). Arrows represents DTI vectors with color map weighted using anisotropic stiffness in C33 direction, which is the compressional coefficient parallel to the fiber direction in different regions of interest.
