
Figure 4:
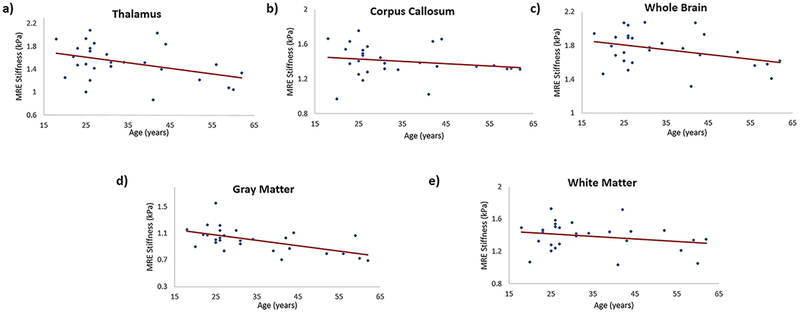
Plot demonstrating the spearman correlation of MRE-derived isotropic stiffness with age in different brain regions; (a) in thalamus with spearman correlation coefficient of −0.32, p = 0.09; (b) in corpus callosum with spearman correlation coefficient of −0.25, p = 0.18; (c) in whole brain with spearman correlation coefficient of −0.26, p = 0.17; (d) in gray matter with spearman correlation coefficient of −0.57, p = 0.001; (e) in white matter with spearman correlation coefficient of −0.16, p = 0.40.