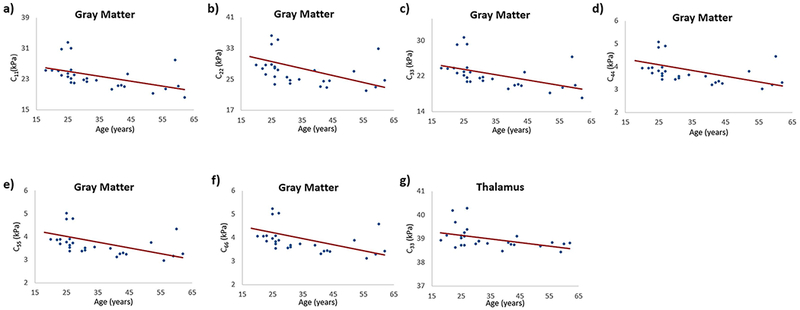
Figure 5:

Plots demonstrating the spearman correlation of anisotropic stiffness coefficients with age in gray matter; (a) C11 vs age with a spearman correlation coefficient of −0.67, p < 0.0001; (b) C22 vs age with a spearman correlation coefficient of −0.63, p = 0.0003; (c) C33 vs age with a spearman correlation coefficient of −0.67, p < 0.0001; (d) C44 vs age with a spearman correlation coefficient of −0.68, p < 0.0001; (e) C55 vs age with a spearman correlation coefficient of −0.66, p = 0.0001; (f) C66 vs age with a spearman correlation coefficient of −0.67, p < 0.0001; and in thalamus (g) C33 vs age with a spearman correlation coefficient of −0.46, p = 0.01.
