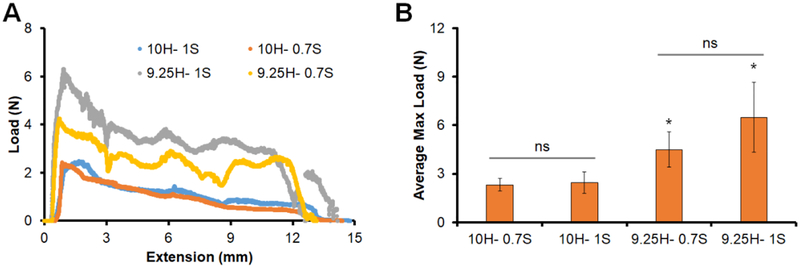
Figure 4. Push out testing of open angled composites.
(A) Representative load-extension curves for open-angle composites. Data shown for four testing conditions. Push-out test from a 10mm dia. defect of composites fabricated from open-angle PLA cages with fiber strut diameters of 0.7mm vs. 1.0mm (10H-1S, 10H-0.7S). Push-out test from a 9.25mm dia. defect of composites fabricated from open-angle PLA cages with fiber strut diameters of 0.7mm vs. 1.0mm (9.25H-1S, 9.25H-0.7S). (B) Average maximum load reached during push out test four all 4 test conditions. * indicates significantly (p < 0.05) higher average maximum load reached than 10mm hole. ns indicates no significance between samples. Data expressed as mean ± standard deviation (n=8).

