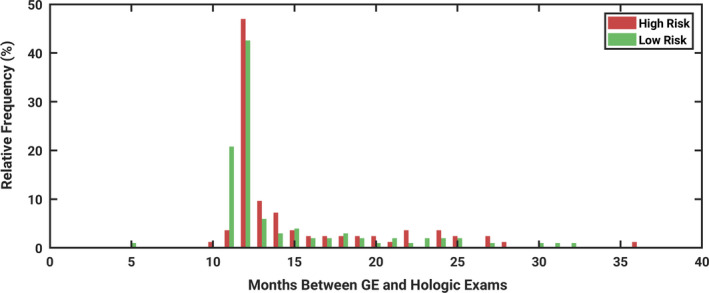
Figure 1.

Histogram demonstrating the interval of time between the date of the GE exam and the Hologic exam, for each patient included in the study. The time between exams were not found to be significantly different between women with and without high‐risk factors present (P = 0.29). [Color figure can be viewed at wileyonlinelibrary.com]
