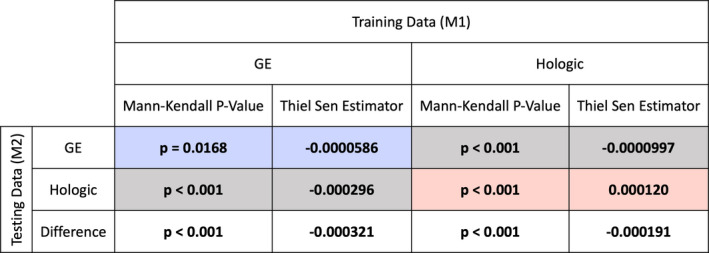
Figure 4.

Results of the Mann–Kendall test for the presence of monotonic trends, and the Thiel–Sen Estimator of such trends for the performance as a function of the number of clusters. Statistically significant values are denoted by boldface font. Colored results (blue, red) correspond to intravendor comparisons using GE and Hologic images, respectively. Gray results correspond to intervendor comparisons. [Color figure can be viewed at wileyonlinelibrary.com]
