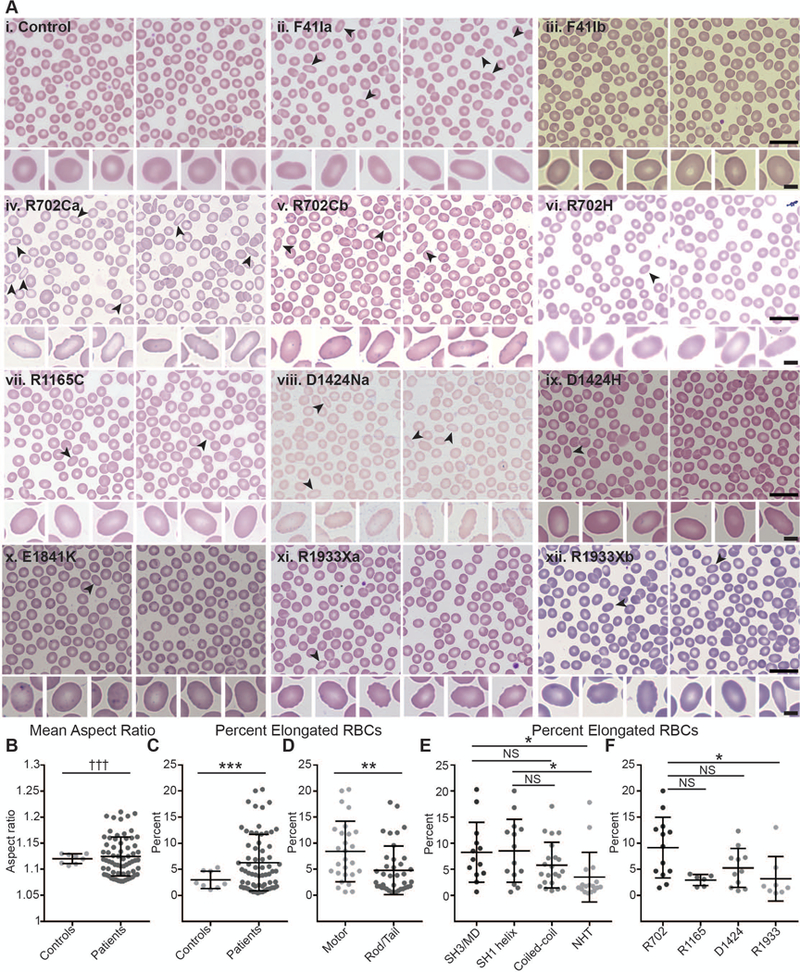
Figure 3.

Wright-Giemsa-stained blood smears from MYH9-RD patients reveal elongated RBCs. (A) Representative images of smears from a normal donor control with no MYH9 mutations (i) and MYH9-RD patients with F41I mutations (ii-iii), R702C mutations (iv-v), a R702H mutation (vi), a R1165C mutation (vii), a D1424N mutation (viii), a D1424H mutation (ix), an E1841K mutation (x), or R1933X mutations (xi-xii) (scale = 20 μm). Elongated RBCs in top rows are denoted by black arrowheads. Bottom rows show typical round RBCs from the normal control (i) and the six most elongated RBCs from each patient (ii-xii) (scale = 4 μm). Lowercase letters following mutations are used to distinguish unique patients with the same mutation. (B) Mean aspect ratios (maximum/minimum axis) measured from images of smears from normal controls or MYH9-RD patients. Welch’s t-test showed no significant differences, but variances were significantly different by F-test (p = 0.0009). (C) Percentage of elongated RBCs (aspect ratios greater than or equal to 1.3) in images of smears from normal controls or MYH9-RD patients. Controls vs. Patients, p = 0.0008 by Welch’s t-test. (D) Percentage of elongated RBCs (aspect ratios greater than or equal to 1.3) in images of smears from MYH9-RD patients with motor or tail domain mutations. Motor vs. Tail, p = 0.0054 by Mann-Whitney test. (E) Percentage of elongated RBCs (aspect ratios greater than or equal to 1.3) in images of smears from MYH9-RD patients with mutations in the SH3/motor domain interface, the SH1 helix, the coiled-coil rod domain, or the non-helical tail (NHT). Kruskal-Wallis test followed by Dunn’s multiple comparisons test showed significant differences between the SH3/MD and the NHT (p = 0.0227) and between the SH1 helix and the NHT (p = 0.0225). (F) Percentage of elongated RBCs (aspect ratios greater than or equal to 1.3) in images of smears from MYH9-RD patients with mutations in R702, R1165, D1424, or R1933 residues of NMIIA. Kruskal-Wallis test followed by Dunn’s multiple comparisons test showed a significant difference between R702 and R1933 patients (p = 0.0227). Lines in dot plots represent mean ± S.D. Controls, n = 8; Patients, n = 66; Motor, n = 27; Tail, n = 39; SH3/MD, n = 13; SH1 helix, n = 14; Coiled-coil, n = 2; NHT, n = 17; R702, n = 13; R1165, n = 6; D1424, n = 11; R1933, n = 8.
