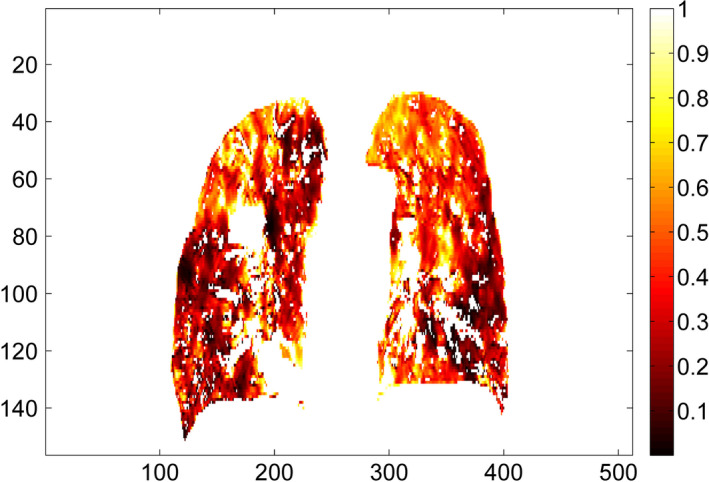
Figure 2.

Illustration of the Jacobian map inside the lung for one representative patient (Patient 3 from Table 1) in coronal view. The deformation vectors are from the deep inspiration breath hold CT to the end of exhalation CT. All the Jacobian values < 1, indicating a volume shrinkage. Jacobian values for the tumor and the high‐density vessels are excluded from this illustration. [Color figure can be viewed at wileyonlinelibrary.com]
