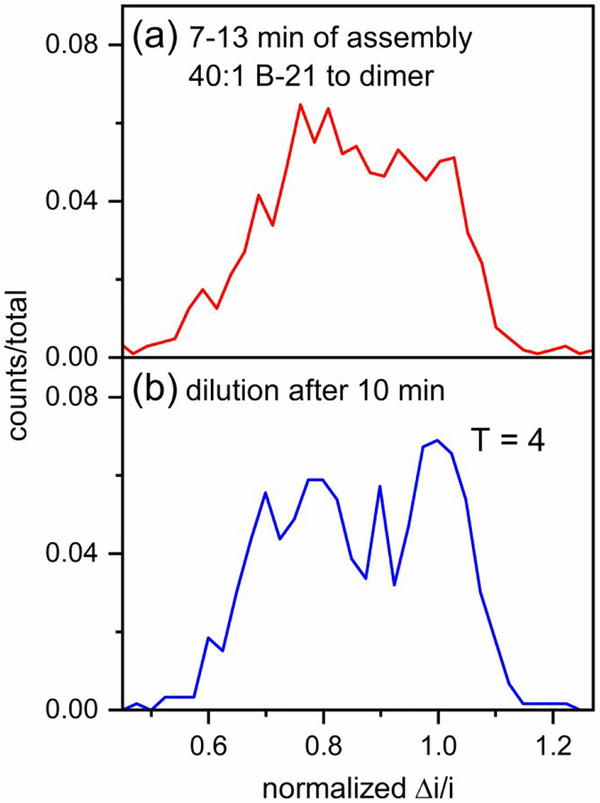
Figure 10. Shift of large intermediates toward T = 4 capsids after dilution.
(a) Pulse-amplitude histogram from measurements of HBV assembly (7–13 min) of 16 μM B-21 and 0.4 μM Cp149 dimer (40:1 molar ratio) in 1 M NaCl. (b) Pulse-amplitude histogram of the reaction solution diluted 10-fold in 1 M NaCl 10 min after the initiation of the reaction and measured for 1–2 h. Pulse amplitudes are normalized to a T = 4 capsid.

