
Figure 5.
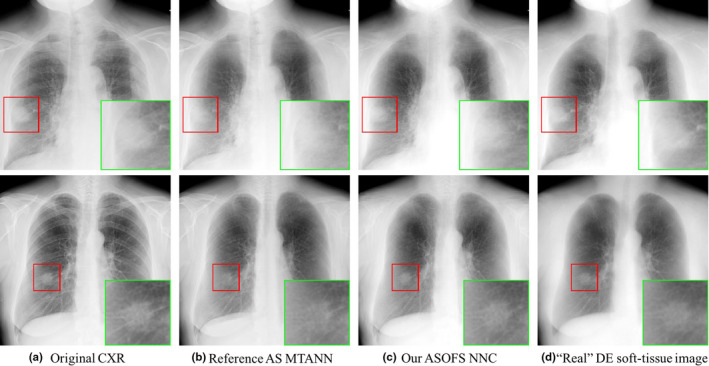
Qualitative comparison of (c) our ASOFS NNC scheme with (b) the reference‐standard AS MTANN for two cases. A region‐of‐interest with a nodule is enlarged in each case for visual assessment. The (a) original CXRs and (d) “real” DE soft‐tissue images from our DE database are shown as references. [Color figure can be viewed at wileyonlinelibrary.com]