
Figure 2: Memory after a long delay (Study 1).
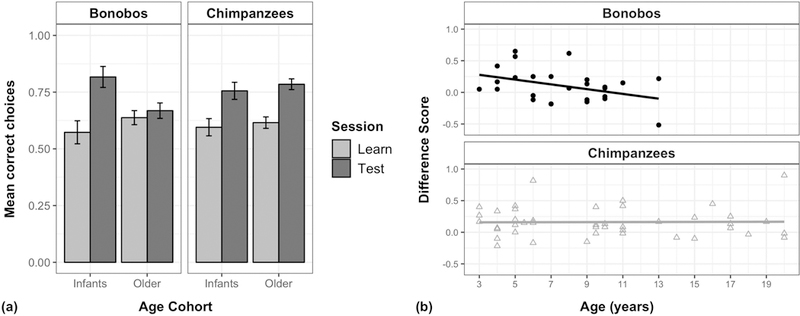
(a) Mean performance in the learning session and test session one week later; error bars indicate SE. (b) Scatter plot of difference scores (indexing each individual’s relative improvement between the introductory and test session), plotted by age for each species (bonobo r2 = 0.15, chimpanzee r2 = 0.00).