
Figure 4: Memory for multiple locations (Study 2).
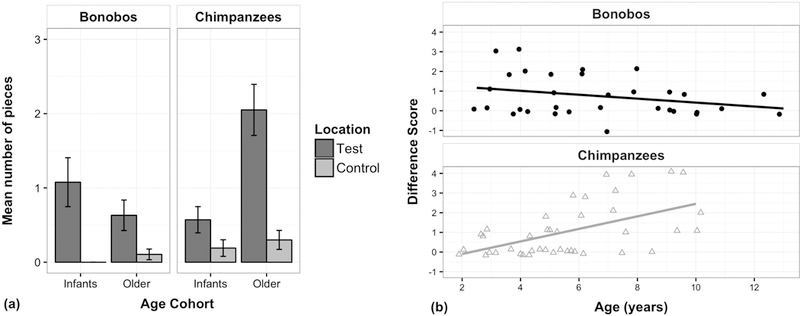
(a) Mean number of test and control pieces found across species and age cohorts; error bars indicate SE. (b) Scatter plot of difference score (indexing each individual’s spatial specificity of searches), plotted by age for each species (bonobos: r2 = 0.08; chimpanzees: r2 = 0.28).