
Figure 7.
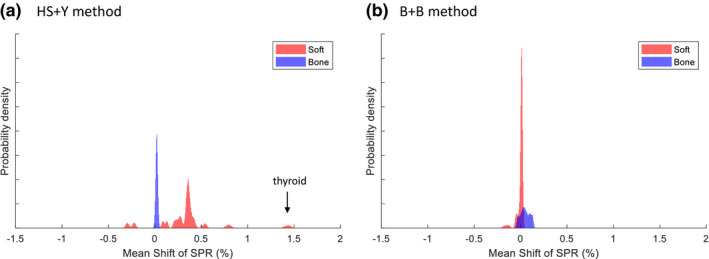
Probability density function (PDF) of the mean shift for 2000 individualized human tissues using (a) the HS + Y method and (b) the B + B method at 2% noise. Twenty‐three soft tissues and 11 bone tissues were considered as is in the ICRU 44 reference. [Color figure can be viewed at wileyonlinelibrary.com]