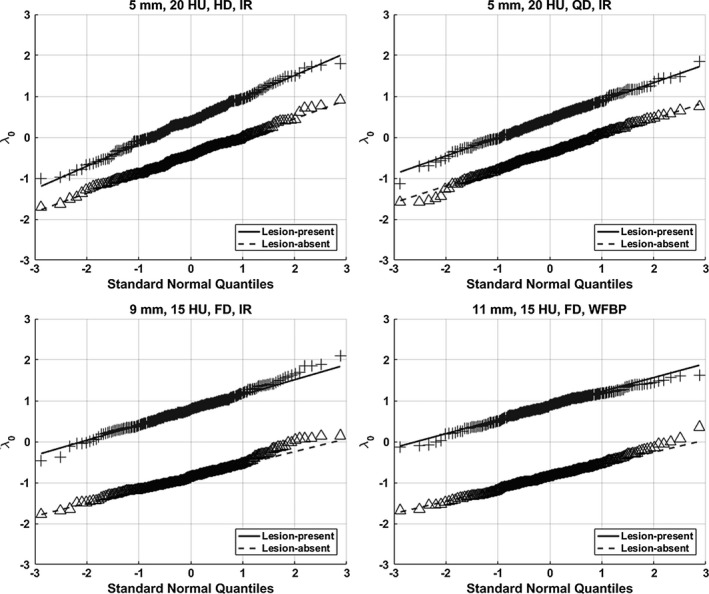
Figure 7.

Examples of normal probability plots of test statistics λ 0 (without internal noise) for lesion‐present/absent cases in experimental conditions #10 (upper left), #9 (upper right), #7 (bottom left), and #8 (bottom right). The distribution of λ 0 approximated the normal distribution.
